Open Access
Fig. A.1.
Download original image
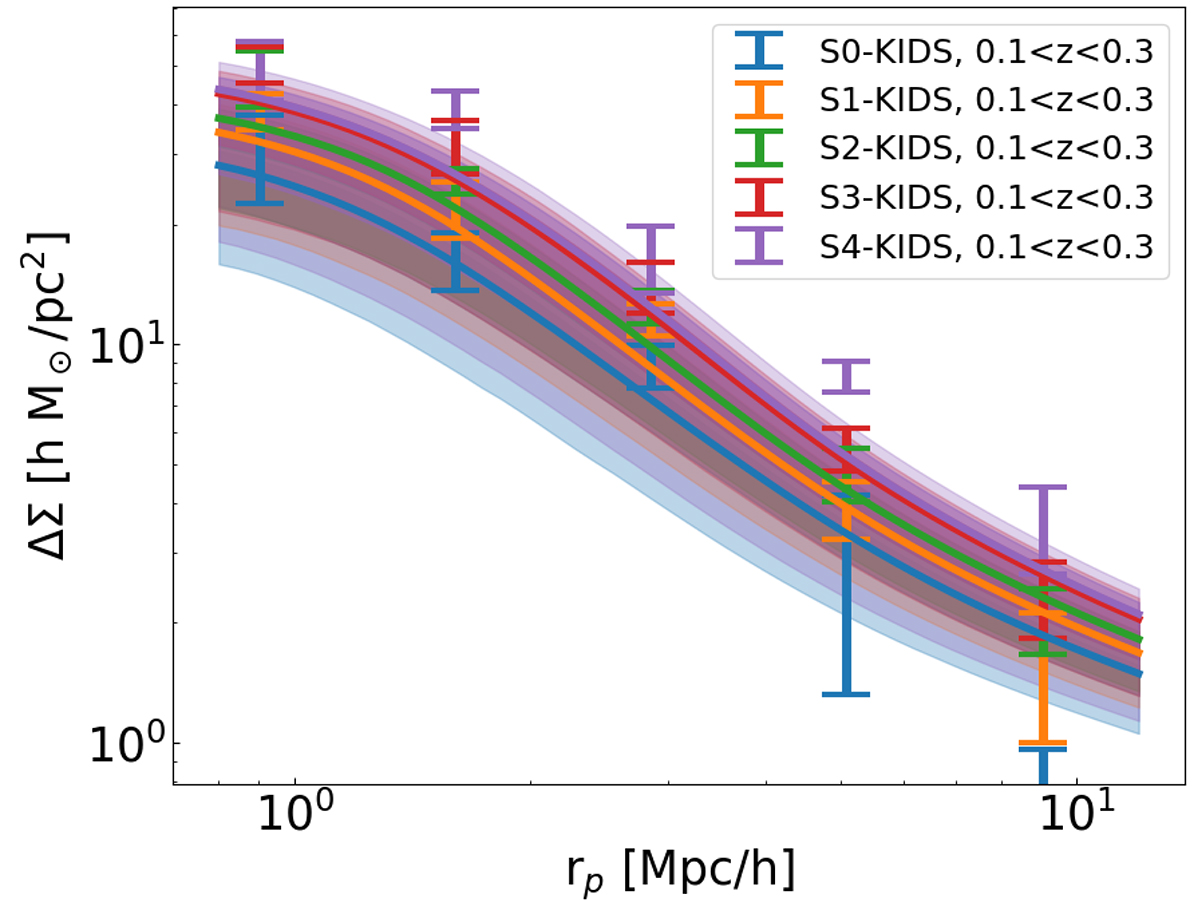
Excess surface density as a function of radial separation measured around eRASS1 clusters with KiDS data. The prediction from our best-fit HOD model is shown by the solid lines. The shaded areas denote the 1-σ and 2-σ confidence in the prediction. Each colour denotes one of the volume-limited samples (see Table 1).
Current usage metrics show cumulative count of Article Views (full-text article views including HTML views, PDF and ePub downloads, according to the available data) and Abstracts Views on Vision4Press platform.
Data correspond to usage on the plateform after 2015. The current usage metrics is available 48-96 hours after online publication and is updated daily on week days.
Initial download of the metrics may take a while.