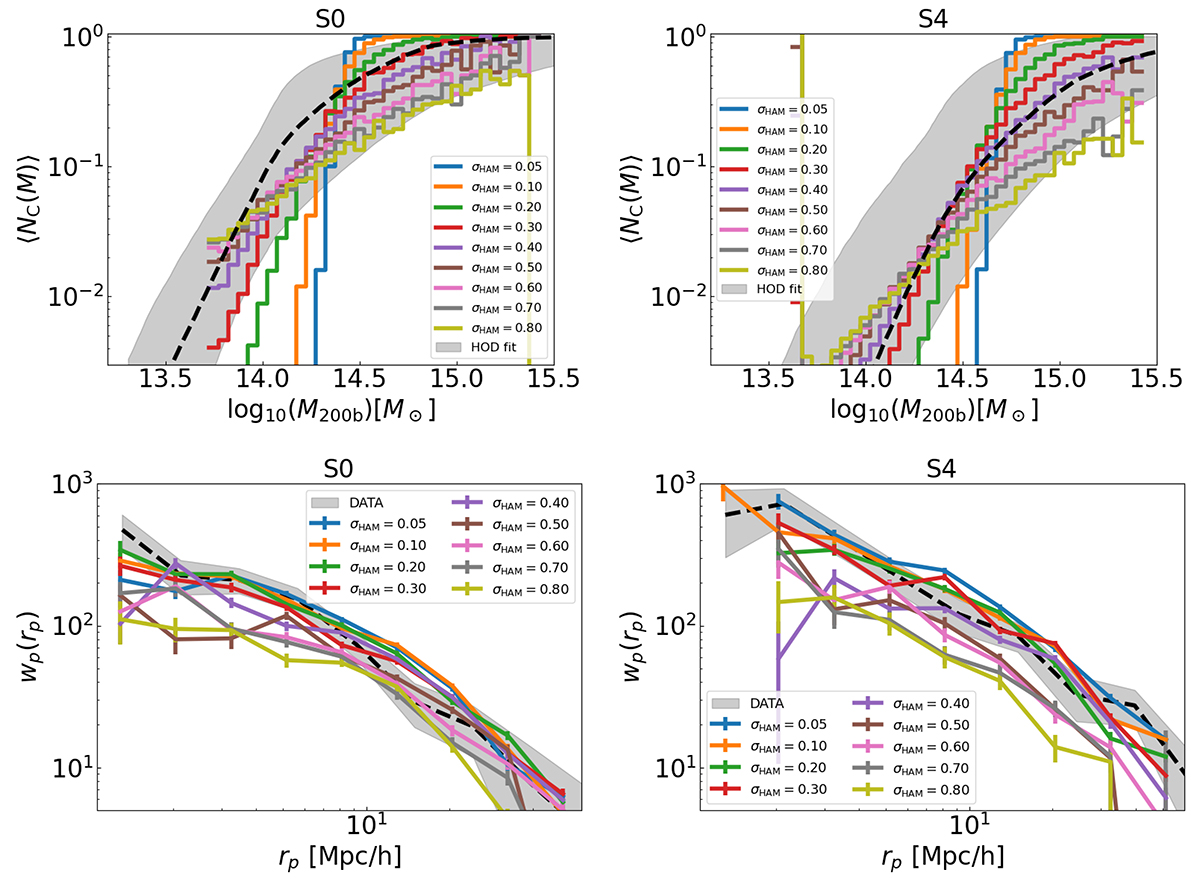
Fig. 11.
Download original image
Comparison between the HOD results from Sect. 4.1 and the abundance matching procedure. The top panels show the prediction for the number of central objects as a function of mass, the bottom panels show the projected correlation function. For clarity, only 9 of the 100 HAM predictions are shown. The panels on the left refer to the S0 sample and the ones on the right to the S4 one. The shaded areas denote the results and measurements from the data; the coloured lines show the HAM predictions with different values of the scatter σHAM.
Current usage metrics show cumulative count of Article Views (full-text article views including HTML views, PDF and ePub downloads, according to the available data) and Abstracts Views on Vision4Press platform.
Data correspond to usage on the plateform after 2015. The current usage metrics is available 48-96 hours after online publication and is updated daily on week days.
Initial download of the metrics may take a while.