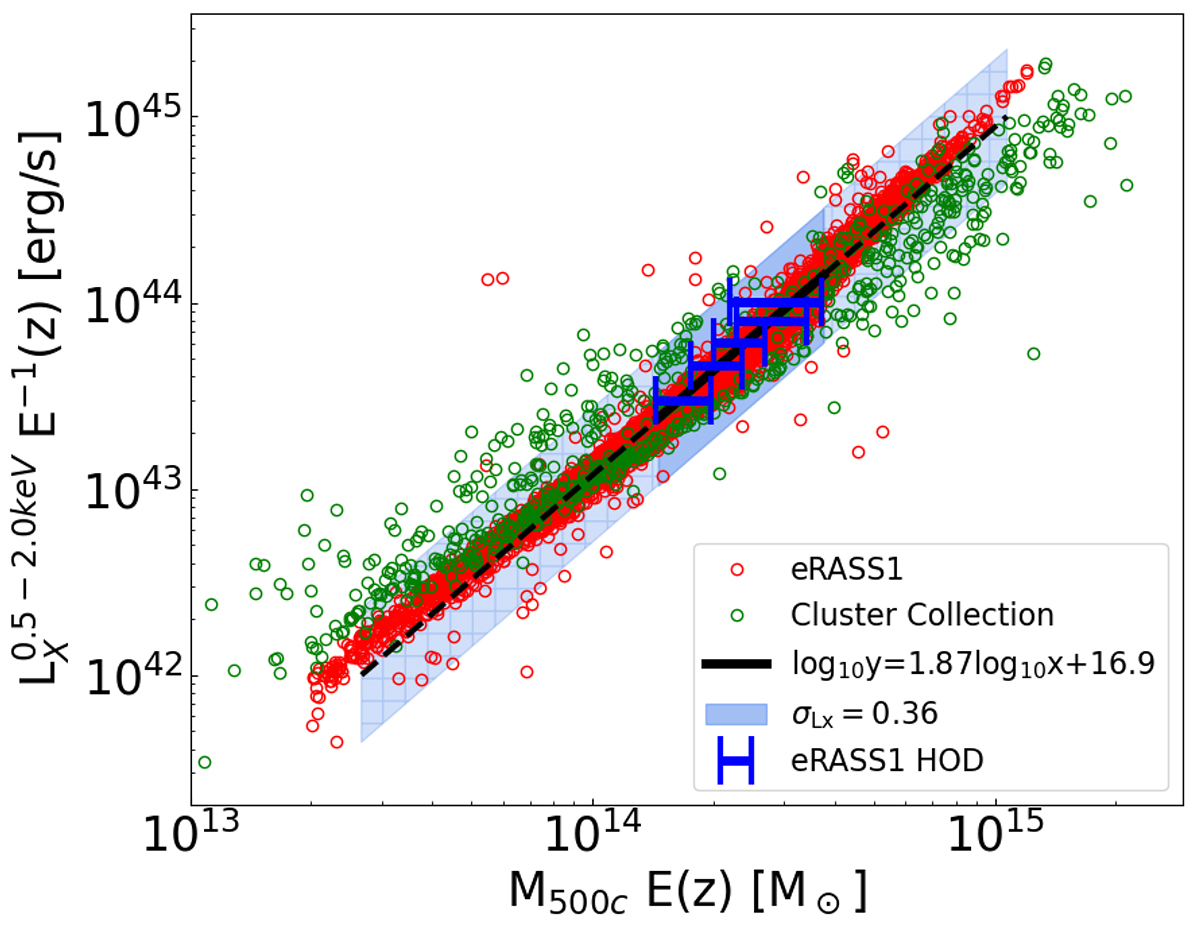
Fig. 10.
Download original image
Scaling relation between halo mass and X-ray luminosity. The halo mass is inferred from our best-fit HOD (in blue). The black line shows a linear fit to our data points. The green dots denote a collection of clusters from Lovisari et al. (2015, 2020), Mantz et al. (2016), Schellenberger & Reiprich (2017), Adami et al. (2018), Bulbul et al. (2019), and Liu et al. (2022). The eRASS1 sample is denoted in red (Bulbul et al. 2024). The shaded area includes a scatter σLx = 0.36 around the mean relation, obtained by the halo abundance matching explained in Sect. 4.2. The extrapolated scaling relation outside the parameter space sensitive to our HOD approach is indicated with the dashed black line and the hatched shaded area.
Current usage metrics show cumulative count of Article Views (full-text article views including HTML views, PDF and ePub downloads, according to the available data) and Abstracts Views on Vision4Press platform.
Data correspond to usage on the plateform after 2015. The current usage metrics is available 48-96 hours after online publication and is updated daily on week days.
Initial download of the metrics may take a while.