Open Access
Fig. 1.
Download original image
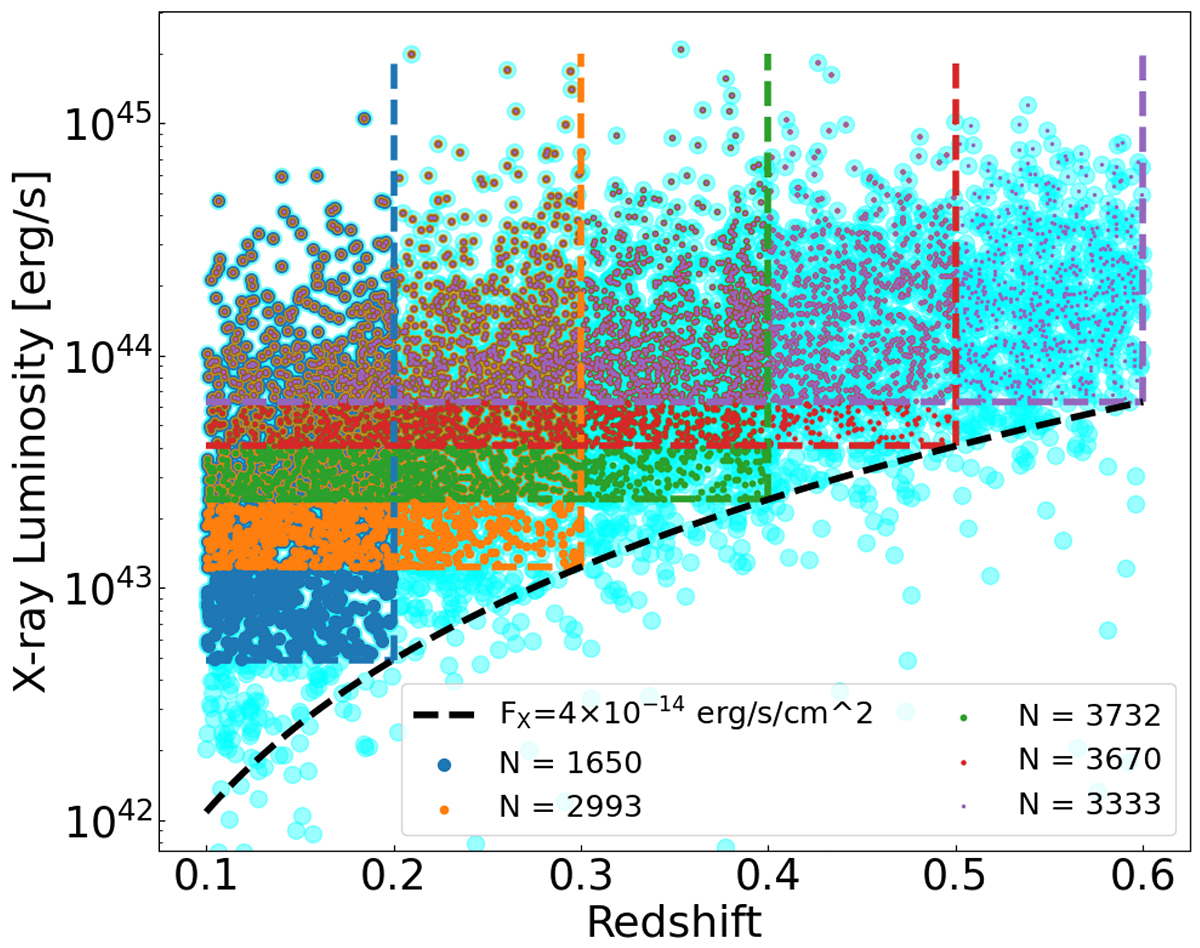
Volume-limited selection of the eRASS1 cluster sample for our clustering study as a function of X-ray luminosity and redshift. The full sample is shown in cyan; the five subsamples are denoted in blue, orange, green, red, and pink.
Current usage metrics show cumulative count of Article Views (full-text article views including HTML views, PDF and ePub downloads, according to the available data) and Abstracts Views on Vision4Press platform.
Data correspond to usage on the plateform after 2015. The current usage metrics is available 48-96 hours after online publication and is updated daily on week days.
Initial download of the metrics may take a while.