Fig. A.2
Download original image
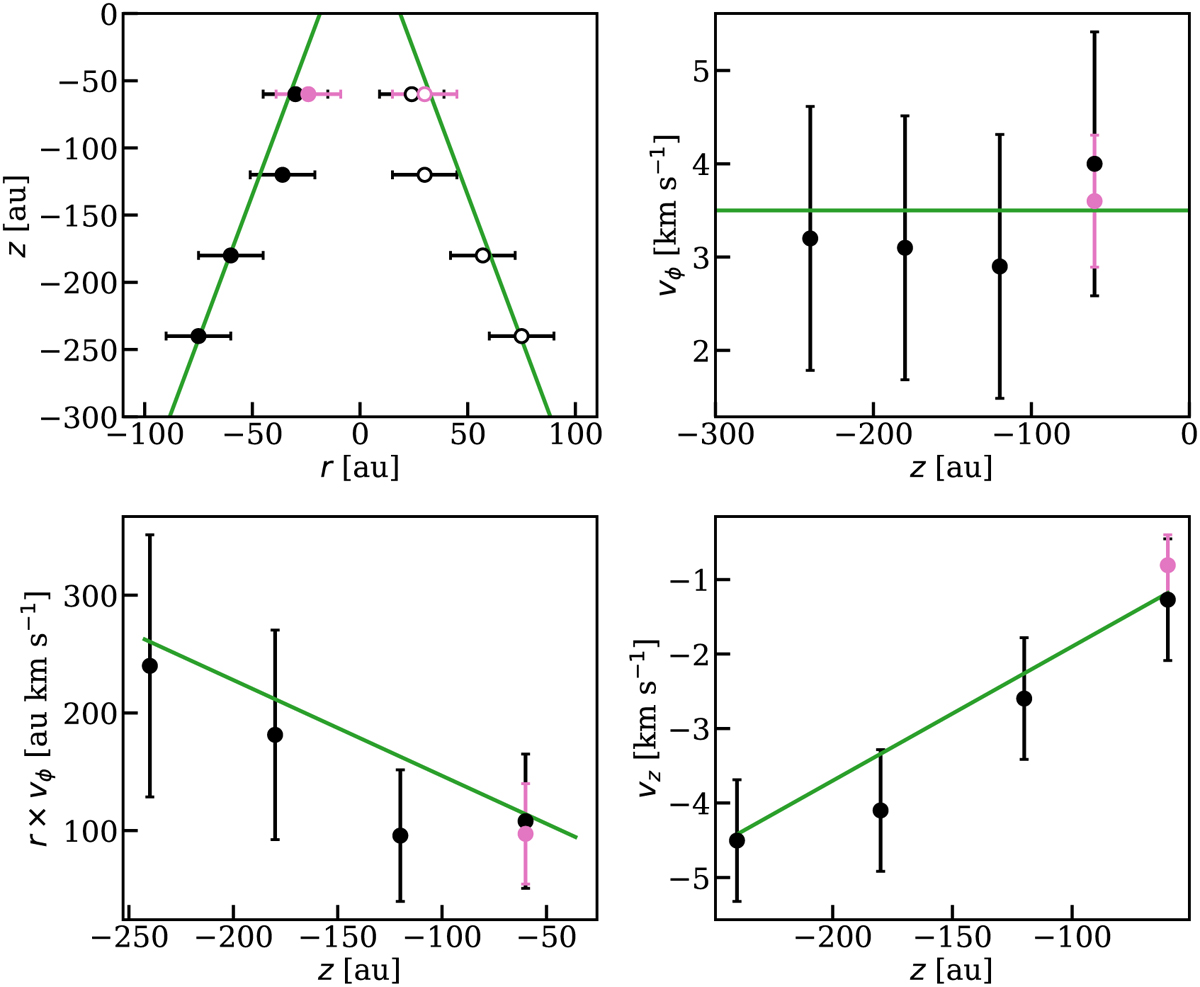
Retrieved shape and kinematics of the wind outermost emitting layer in the red lobe. Radius r (top left), velocities υϕ (top right) and υɀ (bottom right), and specific angular momentum r × υϕ (bottom left) are shown as a function of deprojected altitude ɀ. The data points with error bars represent values for CH3OH (pink) and H13CN (black), derived from the P–V measurements in Table A.1 and deprojected by an inclination i = 30°. The values of r × υϕ are computed using the average flow radius between the two edges. The green lines show our simple conical model that best fit the P–V diagrams in Fig. 5, assuming a flow along the cone walls.
Current usage metrics show cumulative count of Article Views (full-text article views including HTML views, PDF and ePub downloads, according to the available data) and Abstracts Views on Vision4Press platform.
Data correspond to usage on the plateform after 2015. The current usage metrics is available 48-96 hours after online publication and is updated daily on week days.
Initial download of the metrics may take a while.