Fig. 5
Download original image
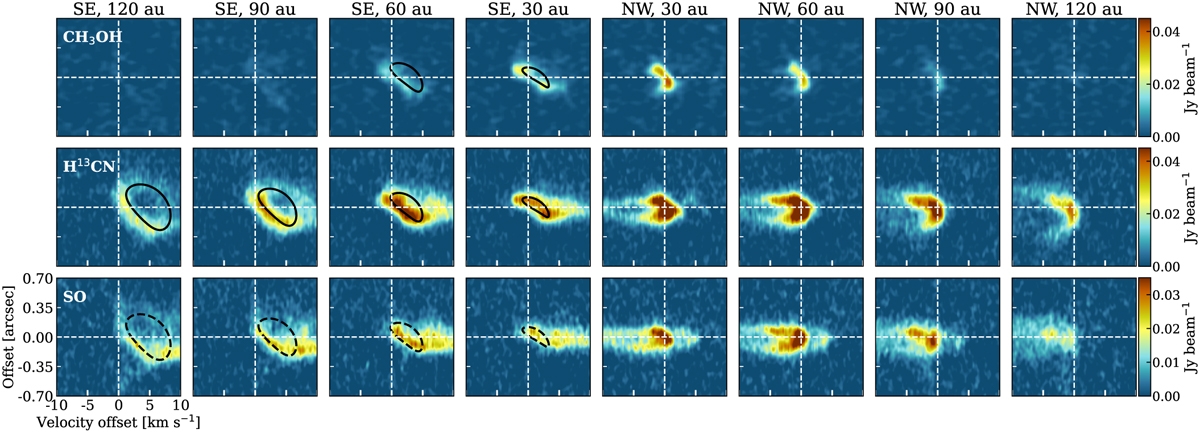
Transverse P–V diagrams of CH3OH (22,1,0−31,2,0), H13CN (4−3), and SO (89−78) perpendicular to the jet axis, at projected offsets ɀproj ~ 30, 60, 90, and 120 au from the continuum peak, and averaged over a slit width of ~1 beam. Cuts through the red (resp. blue) lobe are labeled SE for southeast (resp. NW for northwest). The black solid curves show predictions for a thin shell model of rotating conical flow with a base radius of ~19 au, obtained by fitting the SE P–V cuts of CH3OH and H13CN (see green curves in Fig. A.2). The same model is overlaid in dashed lines on SE P–V cuts of SO for comparison.
Current usage metrics show cumulative count of Article Views (full-text article views including HTML views, PDF and ePub downloads, according to the available data) and Abstracts Views on Vision4Press platform.
Data correspond to usage on the plateform after 2015. The current usage metrics is available 48-96 hours after online publication and is updated daily on week days.
Initial download of the metrics may take a while.