Fig. B.2
Download original image
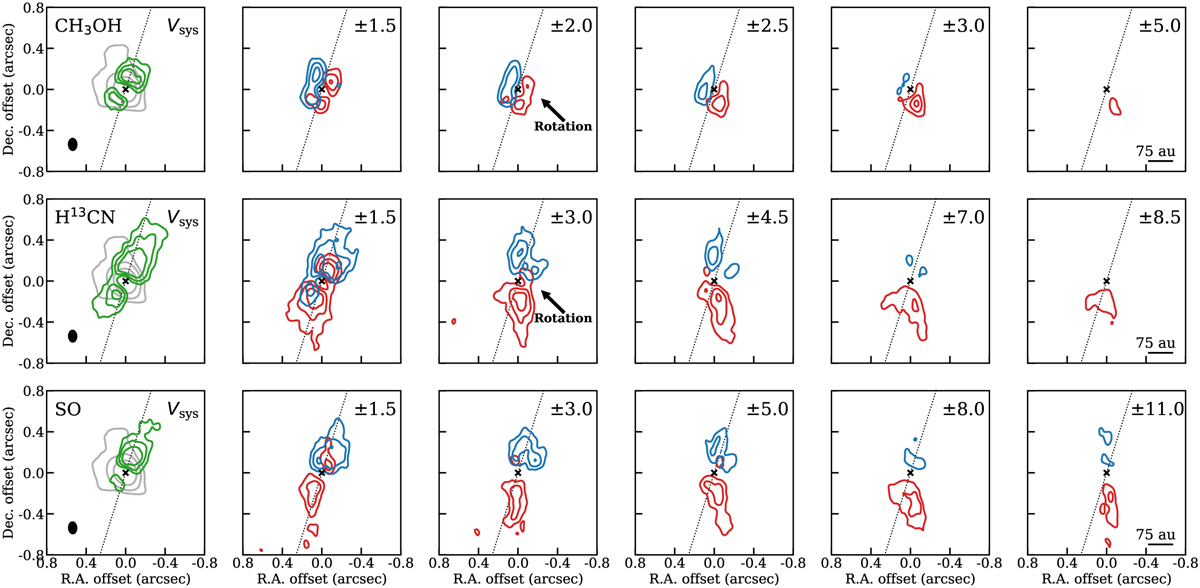
Channel maps of CH3OH (22,1,0 − 31,2,0), H13CN (4-3), and SO (89 − 78) in the inner ~l.5″ region. The continuum contours are shown in gray and they are set at [10, 30, 100]σcont with σcont = 0.25 mJy beam−1. The peak of the continuum is indicated by a cross. The red and blue contours correspond to positive and negative velocities respectively, expressed in km s−1 with respect to the adopted systemic velocity Vsys (= 5.3 km s−1 in the LSR frame). The contour levels are set at [7, 13, 20]σ for CH3OH and H13CN, and [6, 10, 15]σ for SO with σ given in Table 1. The molecules shown here show rotation signatures at |V| < 3 km s−1 in the inner regions or in the outflow emission.
Current usage metrics show cumulative count of Article Views (full-text article views including HTML views, PDF and ePub downloads, according to the available data) and Abstracts Views on Vision4Press platform.
Data correspond to usage on the plateform after 2015. The current usage metrics is available 48-96 hours after online publication and is updated daily on week days.
Initial download of the metrics may take a while.