Fig. 1
Download original image
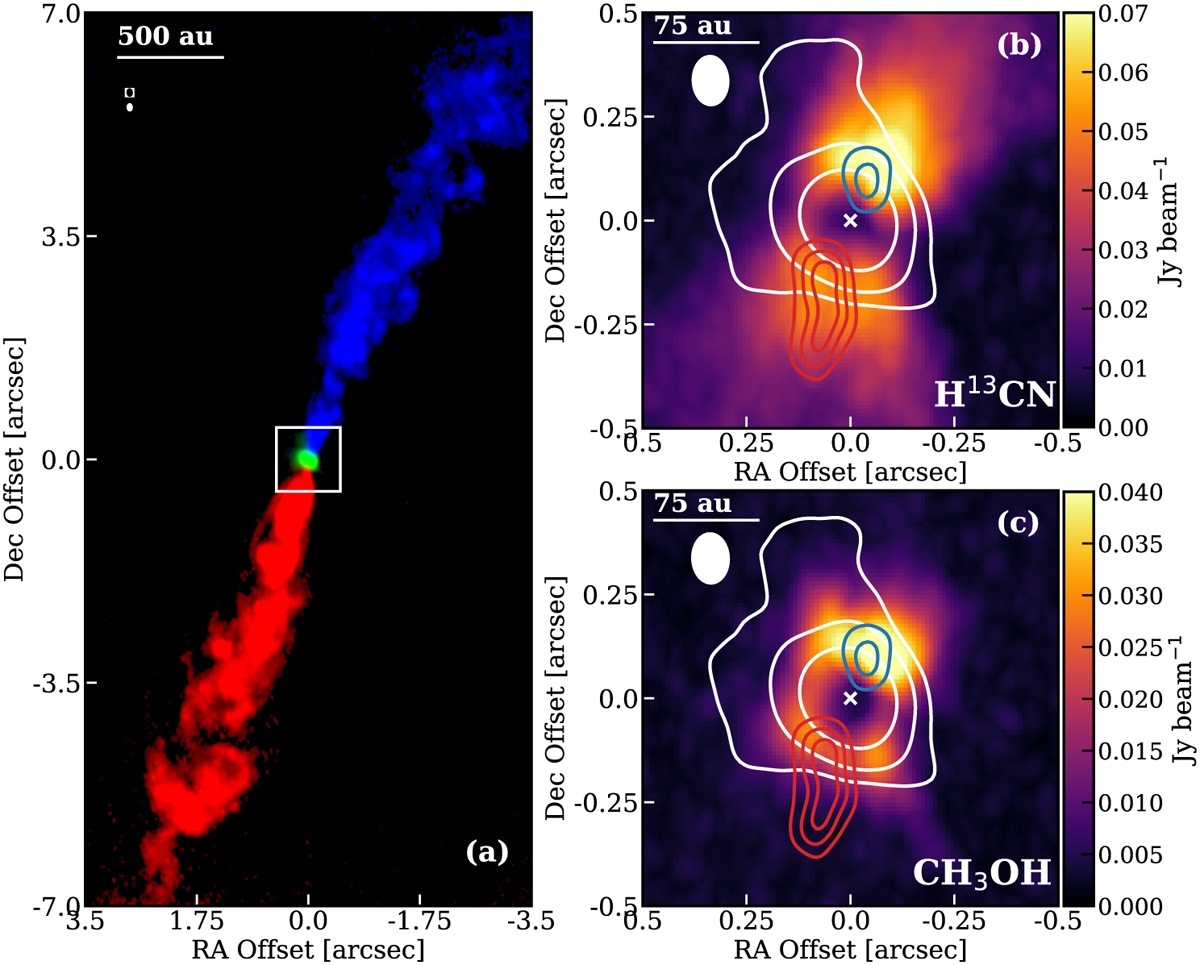
Overview of the Ll448-mm system, as seen by ALMA. Panel a: overview of the region. The red and blue lobes of the jet are indicated by the SiO (8–7) peak intensity map. Green corresponds to the ~0.9 mm continuum. The beams of SiO (empty) and continuum (filled) are shown on the top left. Panel b: zoomed-in image of the H13CN (4–3) peak intensity map with continuum contours in white at [10, 30, 100]σcont with σcont = 0.25 mJy beam−1. Panel c: same as b, but for CH3OH (22,1,0—31,2,0). In panels b and c the peak of the continuum is indicated by a cross and the integrated intensity maps of the high-velocity bullets of SiO (65–75 km s−1) are shown in red and blue contours (at [10, 15, 20]σSiO,mom0 with σSiO,mom0 = 6 mJy beam−1 km s−1).
Current usage metrics show cumulative count of Article Views (full-text article views including HTML views, PDF and ePub downloads, according to the available data) and Abstracts Views on Vision4Press platform.
Data correspond to usage on the plateform after 2015. The current usage metrics is available 48-96 hours after online publication and is updated daily on week days.
Initial download of the metrics may take a while.