Fig. 10
Download original image
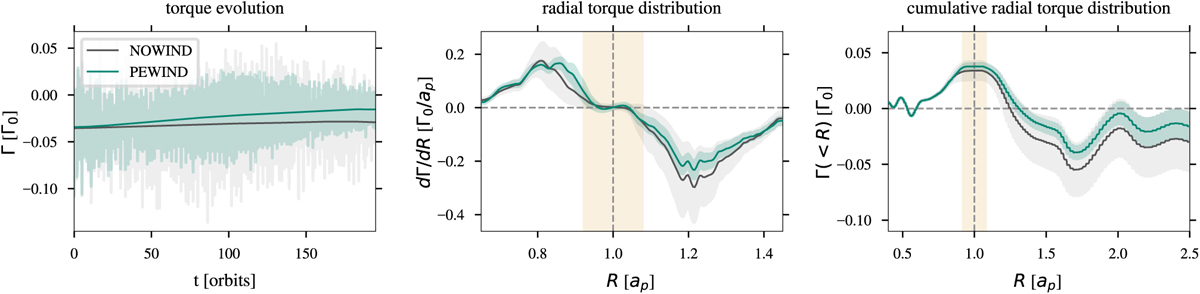
Torque evolution (left panel), radial torque distribution (middle panel), and cumulative radial torque (right panel). The temporal evolution was smoothed with a Gaussian kernel over ten orbits to make the plot more readable, and the shaded area indicates the spread of the actual samples. In the other panels, the shaded area indicates the standard deviation from the mean, calculated from 1000 samples between orbit 190 and 200. The yellow vertical band marks the extent of the planet’s Hill sphere, and horizontal and vertical dashed lines indicate the zero point and the planet’s location, respectively.
Current usage metrics show cumulative count of Article Views (full-text article views including HTML views, PDF and ePub downloads, according to the available data) and Abstracts Views on Vision4Press platform.
Data correspond to usage on the plateform after 2015. The current usage metrics is available 48-96 hours after online publication and is updated daily on week days.
Initial download of the metrics may take a while.