Fig. 6.
Download original image
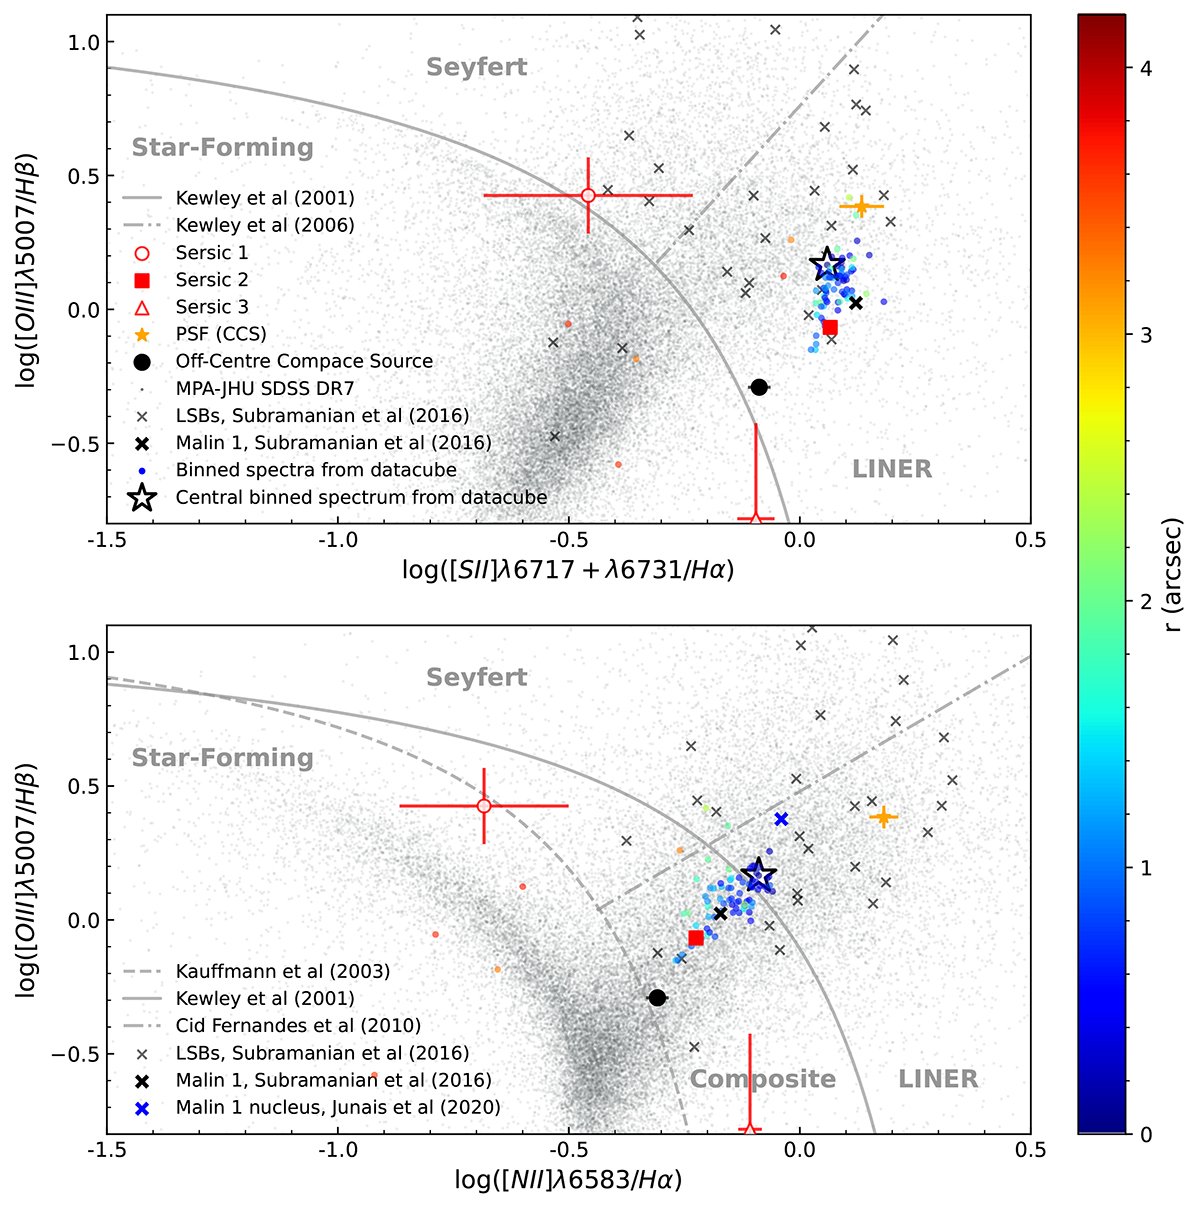
BPT diagrams showing the location of each component modelled by BUDDI as the larger red and yellow points, and of the off-centre compact source as the black filled circle. The open red symbols identify measurements where at least one of the emission lines used had an ANR of less than 3, and so those measurements should be used with caution. Note: the error bars for Sérsic 2 and the off-centre compact source are within the data points. The small coloured points represent the measurements from the original galaxy datacube after binning to increase the S/N, where the colour corresponds to the distance of each binned spectrum from the centre of the galaxy according to the colour bar, and the star symbol is centred on the data point at the centre of the central PSF component. For comparison, the measurements from the MPA-JHU SDSS DR7 galaxies (Brinchmann et al. 2004) have been plotted as grey points, and the central regions of other LSBs from Subramanian et al. (2016) are shown as grey crosses. The black and blue crosses are the emission line ratios from the nuclear region of Malin 1 from Subramanian et al. (2016) and Junais et al. (2020), respectively. The solid curves in both plots represent the maximum starburst line of Kewley et al. (2001), the dashed curve in the bottom plot represents the pure star-forming line of Kauffmann et al. (2003), and the dot-dashed lines in the top and bottom plots differentiate between the Seyfert and LINER classifications according to Kewley et al. (2006) and Cid Fernandes et al. (2010) respectively.
Current usage metrics show cumulative count of Article Views (full-text article views including HTML views, PDF and ePub downloads, according to the available data) and Abstracts Views on Vision4Press platform.
Data correspond to usage on the plateform after 2015. The current usage metrics is available 48-96 hours after online publication and is updated daily on week days.
Initial download of the metrics may take a while.