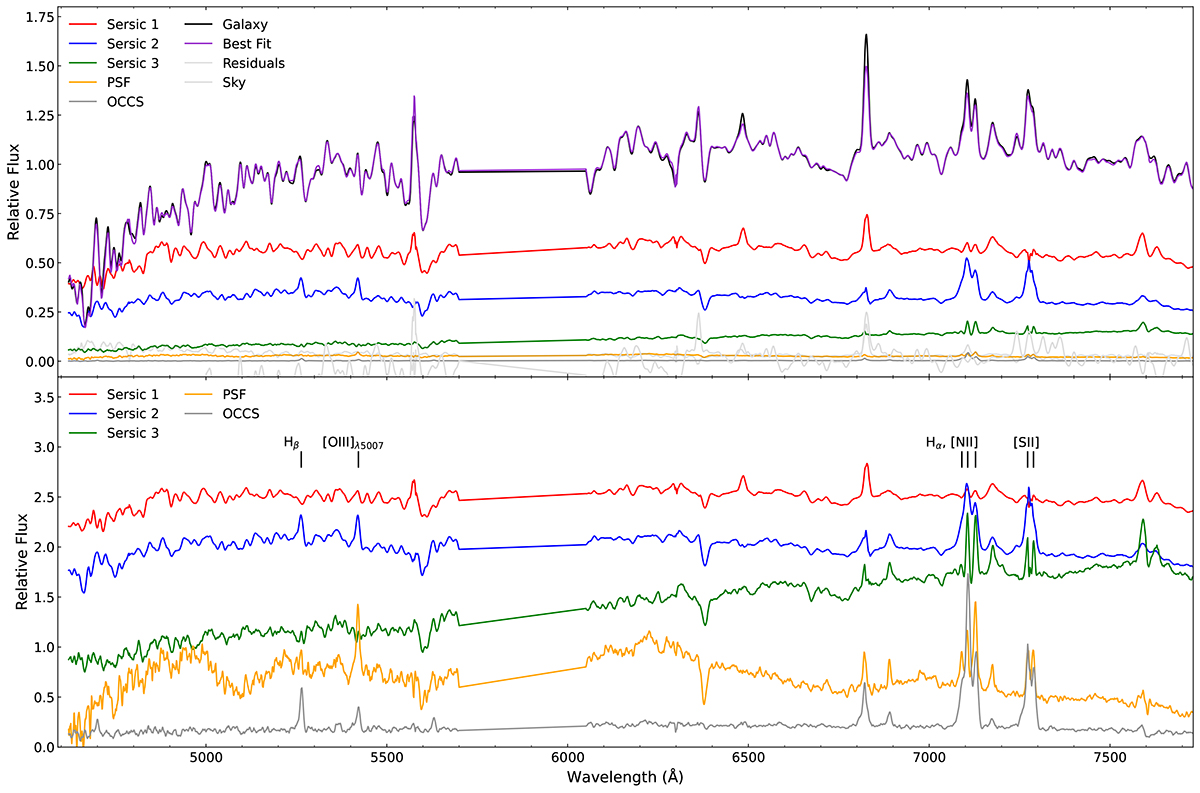
Fig. 5.
Download original image
Overview of the spectra extracted for each component shown in Fig. 4 by BUDDI and the off-centre compact source (labelled OCCS). The integrated spectrum from the original datacube is given in black with the spectrum of the best fit given in purple. The spectra for the three Sérsic components, the PSF component representing the CCS and the off-centre compact source are shown in red, blue, green, orange and dark grey, respectively, and the residuals are given in lighter grey. The top plot shows the spectra relative to the flux of the original datacube, while the bottom plot normalises the spectra for the four components to the flux value interpolated from the middle of the notch region and offsets them arbitrarily to better display the differences in gradients and line strengths. Note that in the bottom plot, to better compare the flux of the off-centre compact source it was normalised to the flux of the PSF component in the notch region. The strong feature at 5577 Å is a sky line.
Current usage metrics show cumulative count of Article Views (full-text article views including HTML views, PDF and ePub downloads, according to the available data) and Abstracts Views on Vision4Press platform.
Data correspond to usage on the plateform after 2015. The current usage metrics is available 48-96 hours after online publication and is updated daily on week days.
Initial download of the metrics may take a while.