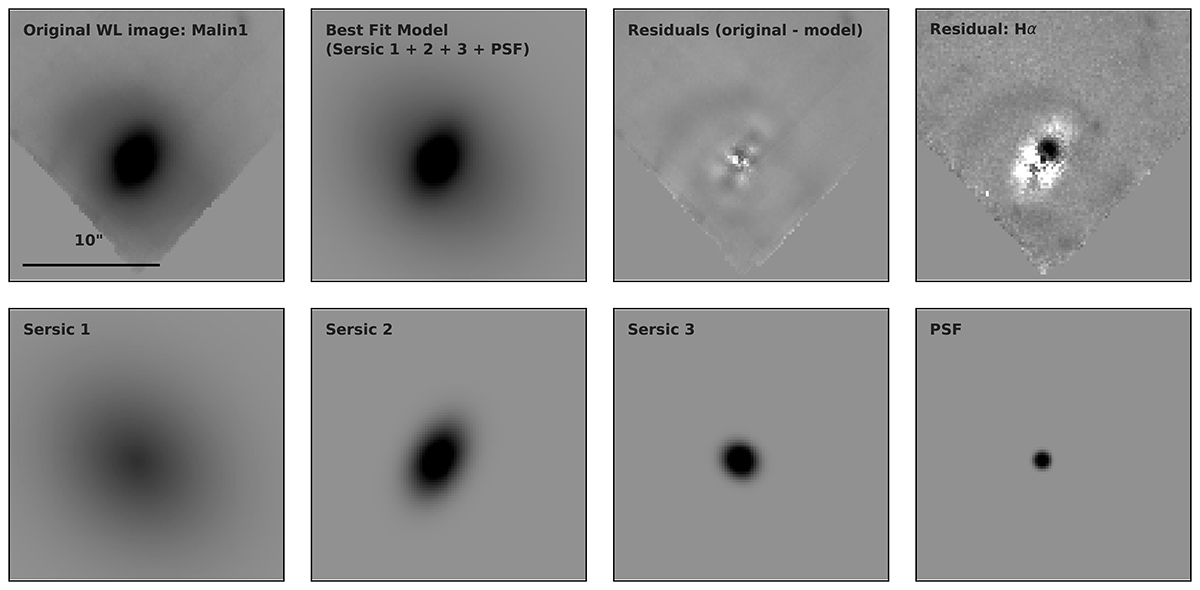
Fig. 4.
Download original image
An example of the fit to Malin 1, zoomed in to show a FOV of 20 × 20″. From left to right, the top row shows the white-light images from the original datacube, the best fit model, the residual image from this fit, and the residual image in the region of the Hα wavelength, while the bottom row shows the three Sérsic components that model the host galaxy and the PSF component that models the brighter source at the core, i.e. the CCS. All images are oriented with north up and east to the left, and use the same flux scaling. A scale bar indicating 10″ is given in the top-left plot.
Current usage metrics show cumulative count of Article Views (full-text article views including HTML views, PDF and ePub downloads, according to the available data) and Abstracts Views on Vision4Press platform.
Data correspond to usage on the plateform after 2015. The current usage metrics is available 48-96 hours after online publication and is updated daily on week days.
Initial download of the metrics may take a while.