Fig. 2.
Download original image
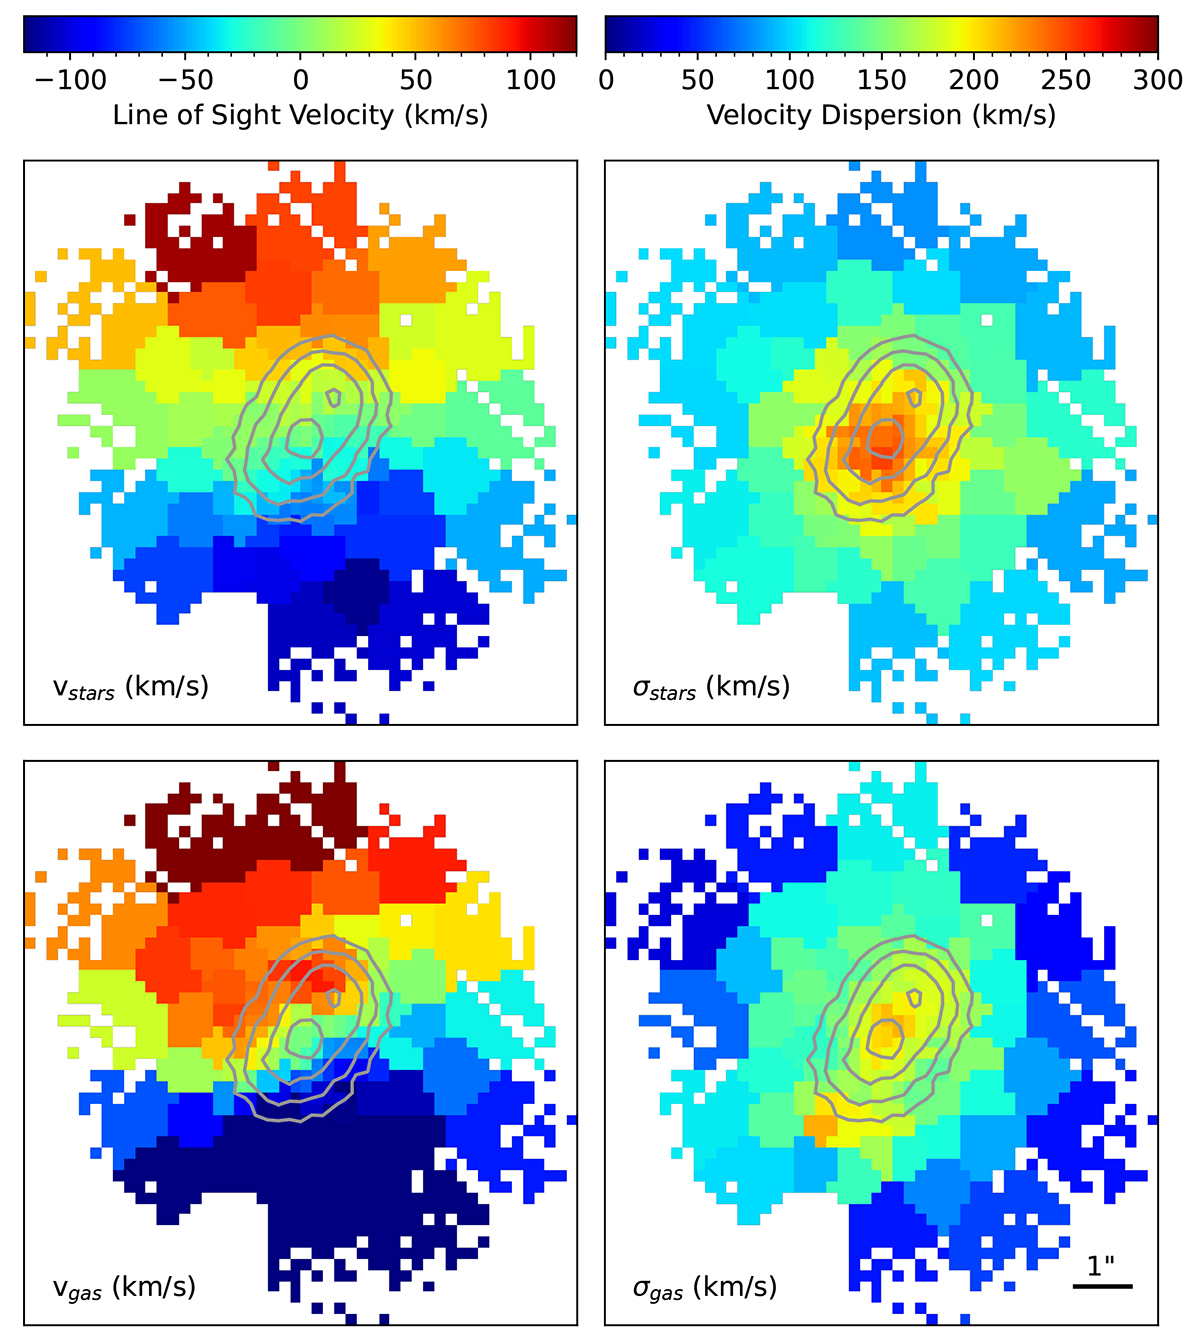
Maps of the stellar (top) and gas (bottom) velocity (left) and velocity dispersion (right) in the central region of Malin 1. The field of view is the same as the bottom plot in Fig. 1, and the contours from that figure are recreated here for reference. A scale bar is given in the bottom right of the gas velocity dispersion plot.
Current usage metrics show cumulative count of Article Views (full-text article views including HTML views, PDF and ePub downloads, according to the available data) and Abstracts Views on Vision4Press platform.
Data correspond to usage on the plateform after 2015. The current usage metrics is available 48-96 hours after online publication and is updated daily on week days.
Initial download of the metrics may take a while.