Open Access
Fig. 4
Download original image
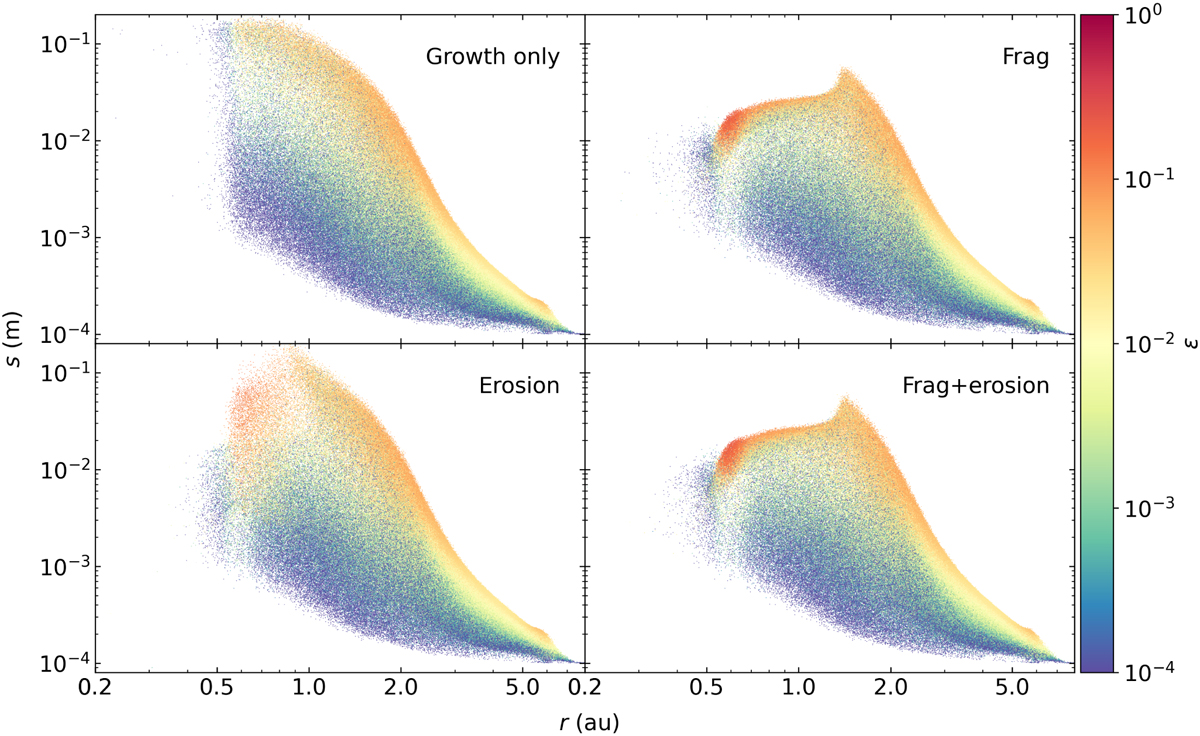
Comparison between simulations in the (r, s) plane at t = 100 yr with growth only (top left), growth and fragmentation (top right) with υfrag,Si = 80 m s−1, growth and erosion (bottom left), and growth, fragmentation, and erosion (bottom right). The colour gives the dust-to-gas ratio.
Current usage metrics show cumulative count of Article Views (full-text article views including HTML views, PDF and ePub downloads, according to the available data) and Abstracts Views on Vision4Press platform.
Data correspond to usage on the plateform after 2015. The current usage metrics is available 48-96 hours after online publication and is updated daily on week days.
Initial download of the metrics may take a while.