Fig. 1
Download original image
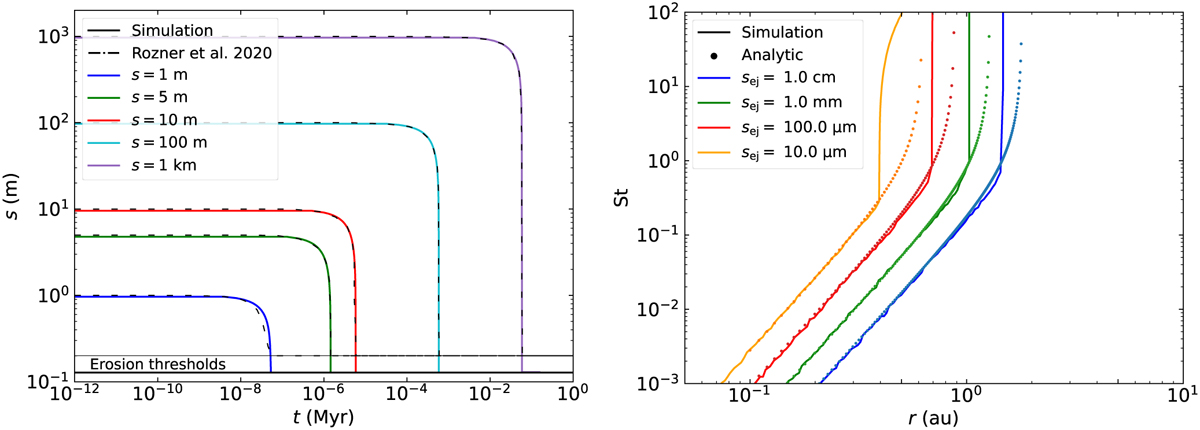
Validation tests. Left: time evolution of the size, s, of different aggregates as they are eroded. The vertical turnover in the profile gives the characteristic erosion time. The aggregates are kept at a fixed distance of 1 au from the star, and the ejected dust has a size of 100 µm. Dashed lines represent data from R20, which are in excellent agreement with our results. Right: Stokes number at the erosion threshold for aggregates drifting towards the star and four different sizes of ejected grains. Dotted lines represent the analytical solution presented in G20.
Current usage metrics show cumulative count of Article Views (full-text article views including HTML views, PDF and ePub downloads, according to the available data) and Abstracts Views on Vision4Press platform.
Data correspond to usage on the plateform after 2015. The current usage metrics is available 48-96 hours after online publication and is updated daily on week days.
Initial download of the metrics may take a while.