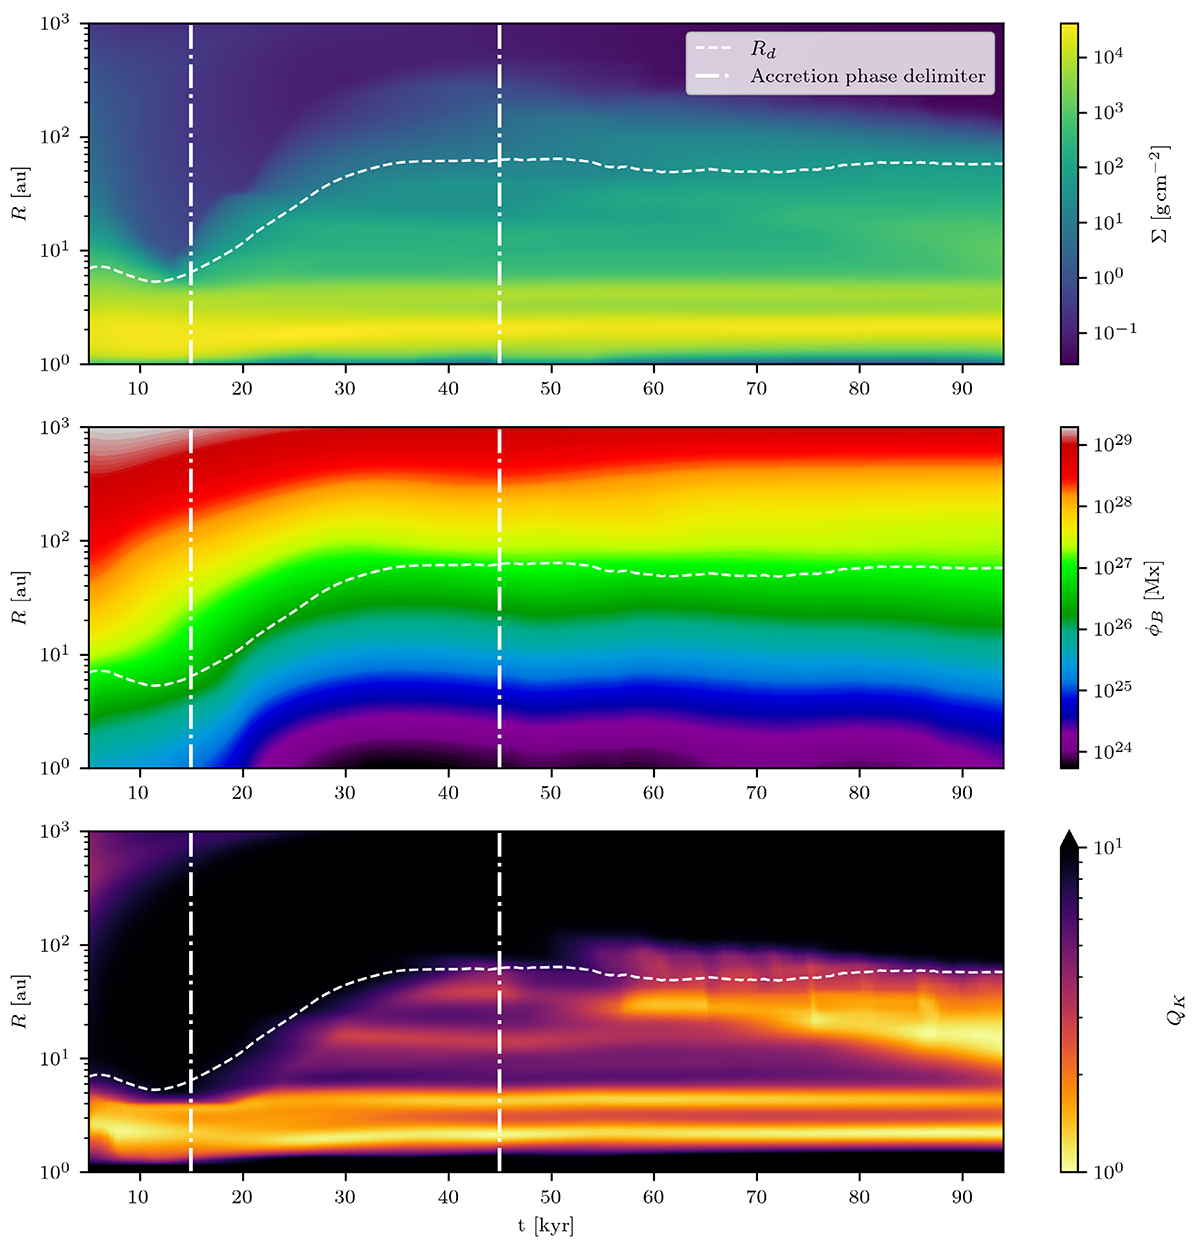
Fig. 7.
Download original image
Spacetime diagrams of the surface density (top panel), poloidal magnetic flux (middle panel), and Toomre parameter (bottom panel). Colors and radii are in log scale. The dashed white line corresponds to the disk radius, and dash-dotted white lines delimit the three accretion phases. Data were convolved in time using a 10 kyr window (equivalent to 8 orbits at 100 au).
Current usage metrics show cumulative count of Article Views (full-text article views including HTML views, PDF and ePub downloads, according to the available data) and Abstracts Views on Vision4Press platform.
Data correspond to usage on the plateform after 2015. The current usage metrics is available 48-96 hours after online publication and is updated daily on week days.
Initial download of the metrics may take a while.