Fig. 4.
Download original image
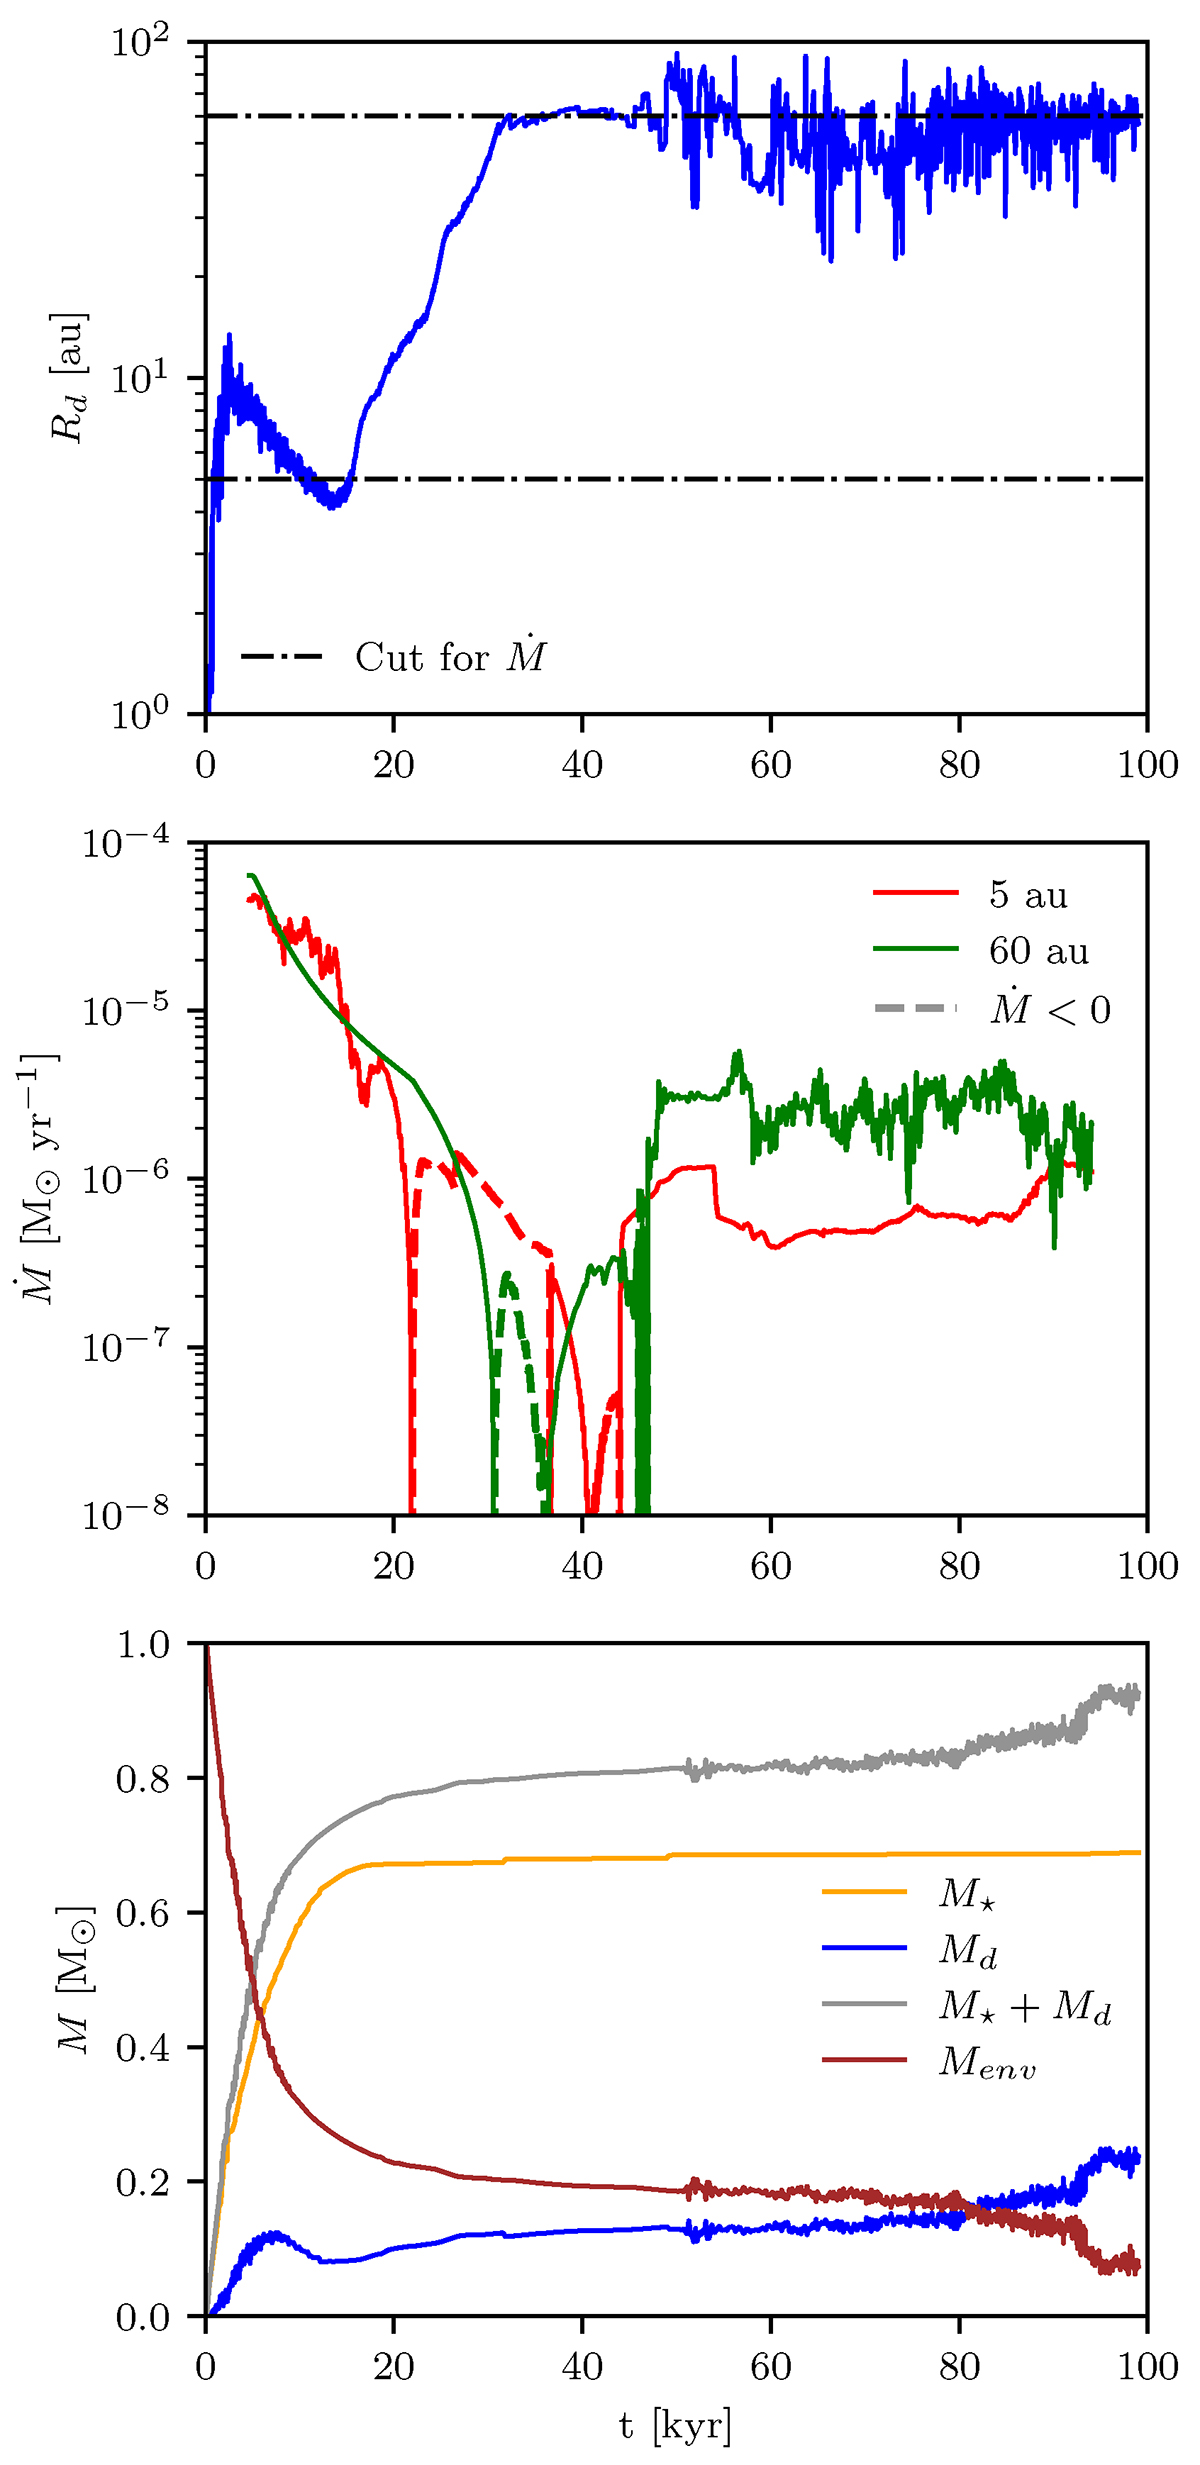
Top panel: radius of the disk over time. The dash-dotted black lines emphasize the radii where the mass accretion rate is inspected in the next panel. Middle panel: mass accretion rate over time near the protostar (R = 5 au, red) and at the maximum stable outer radius (R = 60 au, green). Dashed lines correspond to expanding material. Bottom panel: protostar mass (orange), disk mass (blue), the total mass of the disk-protostar system (gray), and envelope mass (brown) over time. Data for the accretion rate are convolved in time using a 10 kyr window (equivalent to 8 orbits at 100 au).
Current usage metrics show cumulative count of Article Views (full-text article views including HTML views, PDF and ePub downloads, according to the available data) and Abstracts Views on Vision4Press platform.
Data correspond to usage on the plateform after 2015. The current usage metrics is available 48-96 hours after online publication and is updated daily on week days.
Initial download of the metrics may take a while.