Fig. 2.
Download original image
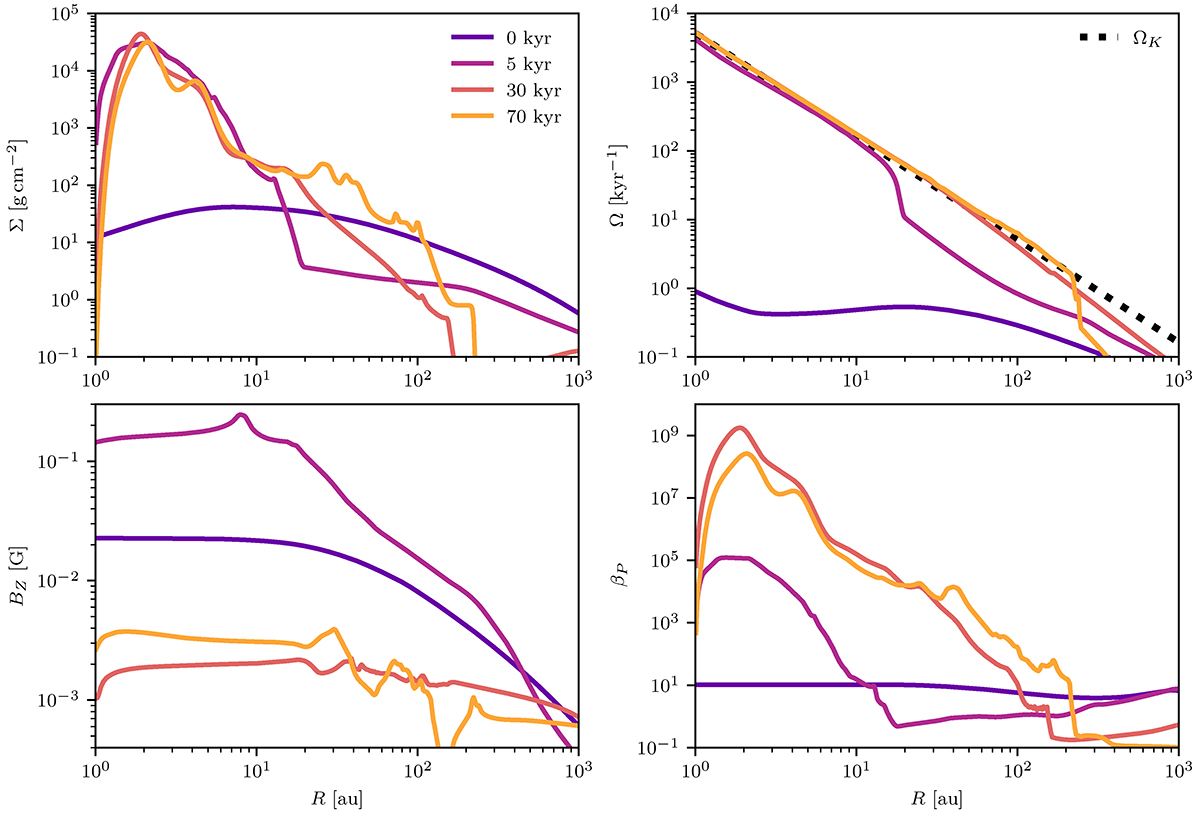
Azimuthally averaged surface density (top left), rotation rate (top right), poloidal magnetic field intensity (bottom left), and plasma parameter βP (bottom right) versus the radius, computed in the midplane. Each color corresponds to one snapshot, the darker being the disk formation epoch, while the lighter is associated with the later times of the simulation. In the top right panel, the dashed black line is the theoretical Keplerian rotation rate with M⋆ ≈ 0.7 M⊙.
Current usage metrics show cumulative count of Article Views (full-text article views including HTML views, PDF and ePub downloads, according to the available data) and Abstracts Views on Vision4Press platform.
Data correspond to usage on the plateform after 2015. The current usage metrics is available 48-96 hours after online publication and is updated daily on week days.
Initial download of the metrics may take a while.