Open Access
Fig. 14.
Download original image
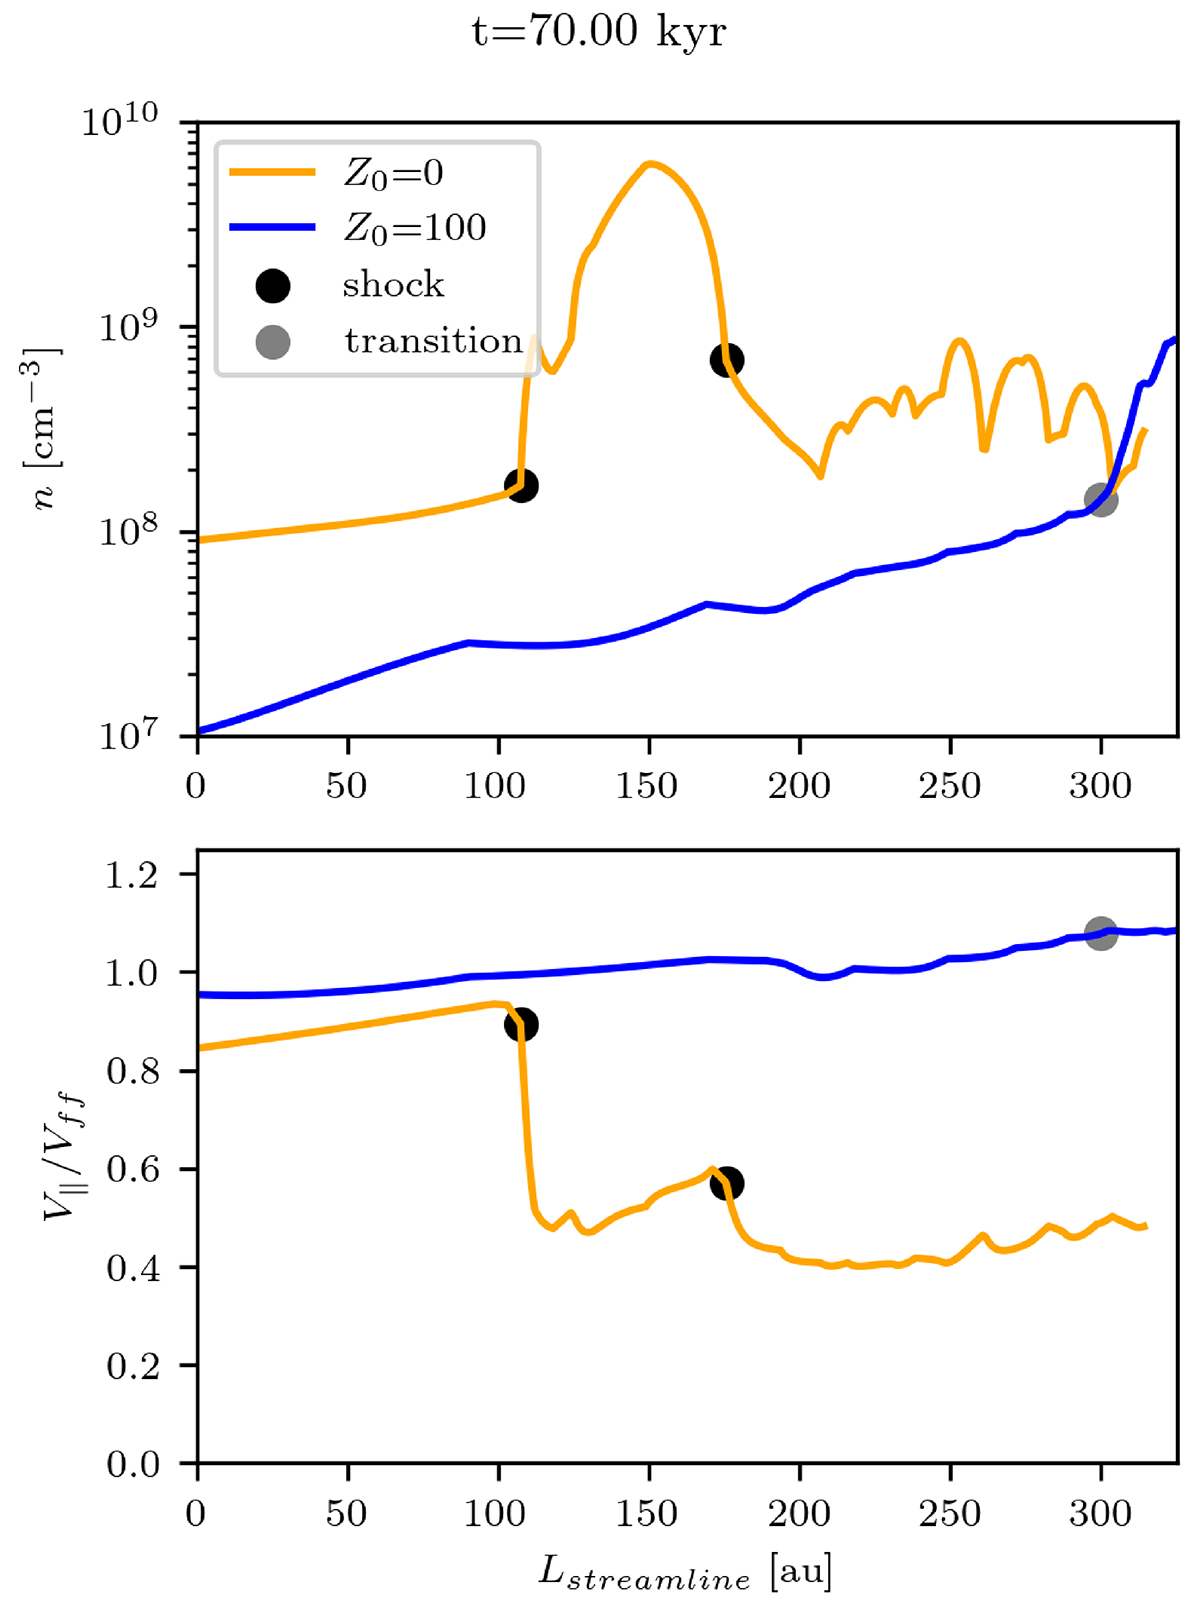
Top: particle density along the streamlines starting at Z0 = 0 au and Z0 = 100 au respectively. Bottom: Gas velocity projected along each streamline. Colors and dots are the same as in Fig. 13.
Current usage metrics show cumulative count of Article Views (full-text article views including HTML views, PDF and ePub downloads, according to the available data) and Abstracts Views on Vision4Press platform.
Data correspond to usage on the plateform after 2015. The current usage metrics is available 48-96 hours after online publication and is updated daily on week days.
Initial download of the metrics may take a while.