Fig. 13.
Download original image
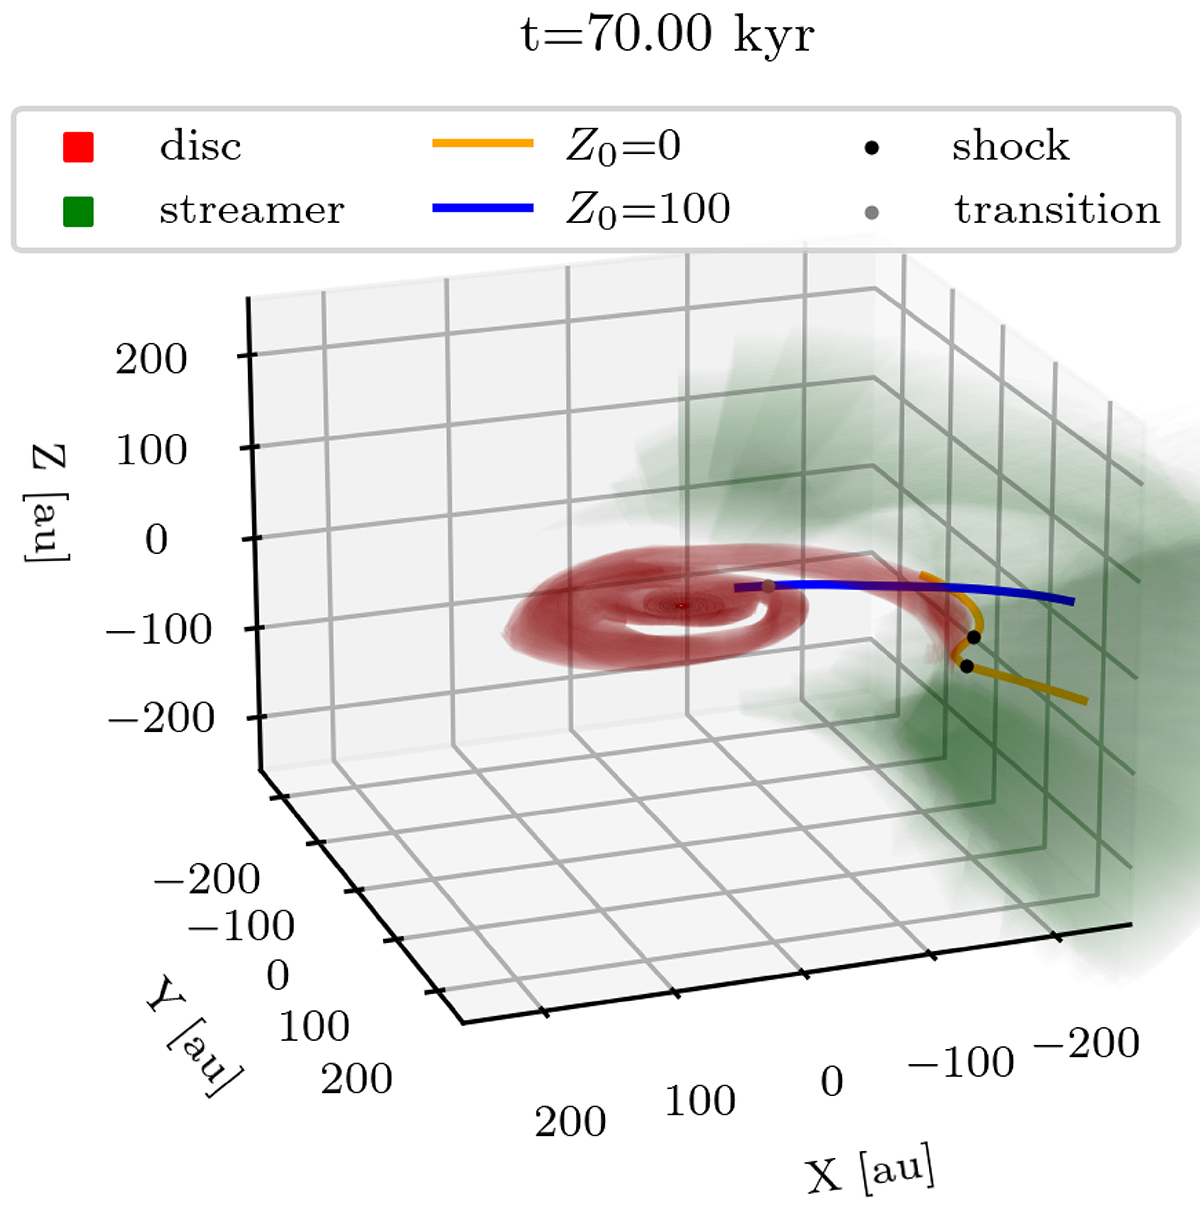
Three-dimensional representation of the disk and streamer with two attached streamlines at time 70 kyr. Red surfaces correspond to the disk, while green surfaces represent the streamer. Both streamlines start at R = 350 au and φ = φstreamer with respectively Z = 0 (orange solid line) and Z = 100 au (blue solid line). Black dots indicate shocks (or rarefactions) along the streamlines while the gray dot corresponds to a density transition (see Fig. 14 for their identification). For an animated version of the figure with a large-scale visualization of the streamer, see https://cloud.univ-grenoble-alpes.fr/s/ZNwHrbWg8A24Trb.
Current usage metrics show cumulative count of Article Views (full-text article views including HTML views, PDF and ePub downloads, according to the available data) and Abstracts Views on Vision4Press platform.
Data correspond to usage on the plateform after 2015. The current usage metrics is available 48-96 hours after online publication and is updated daily on week days.
Initial download of the metrics may take a while.