Fig. 11.
Download original image
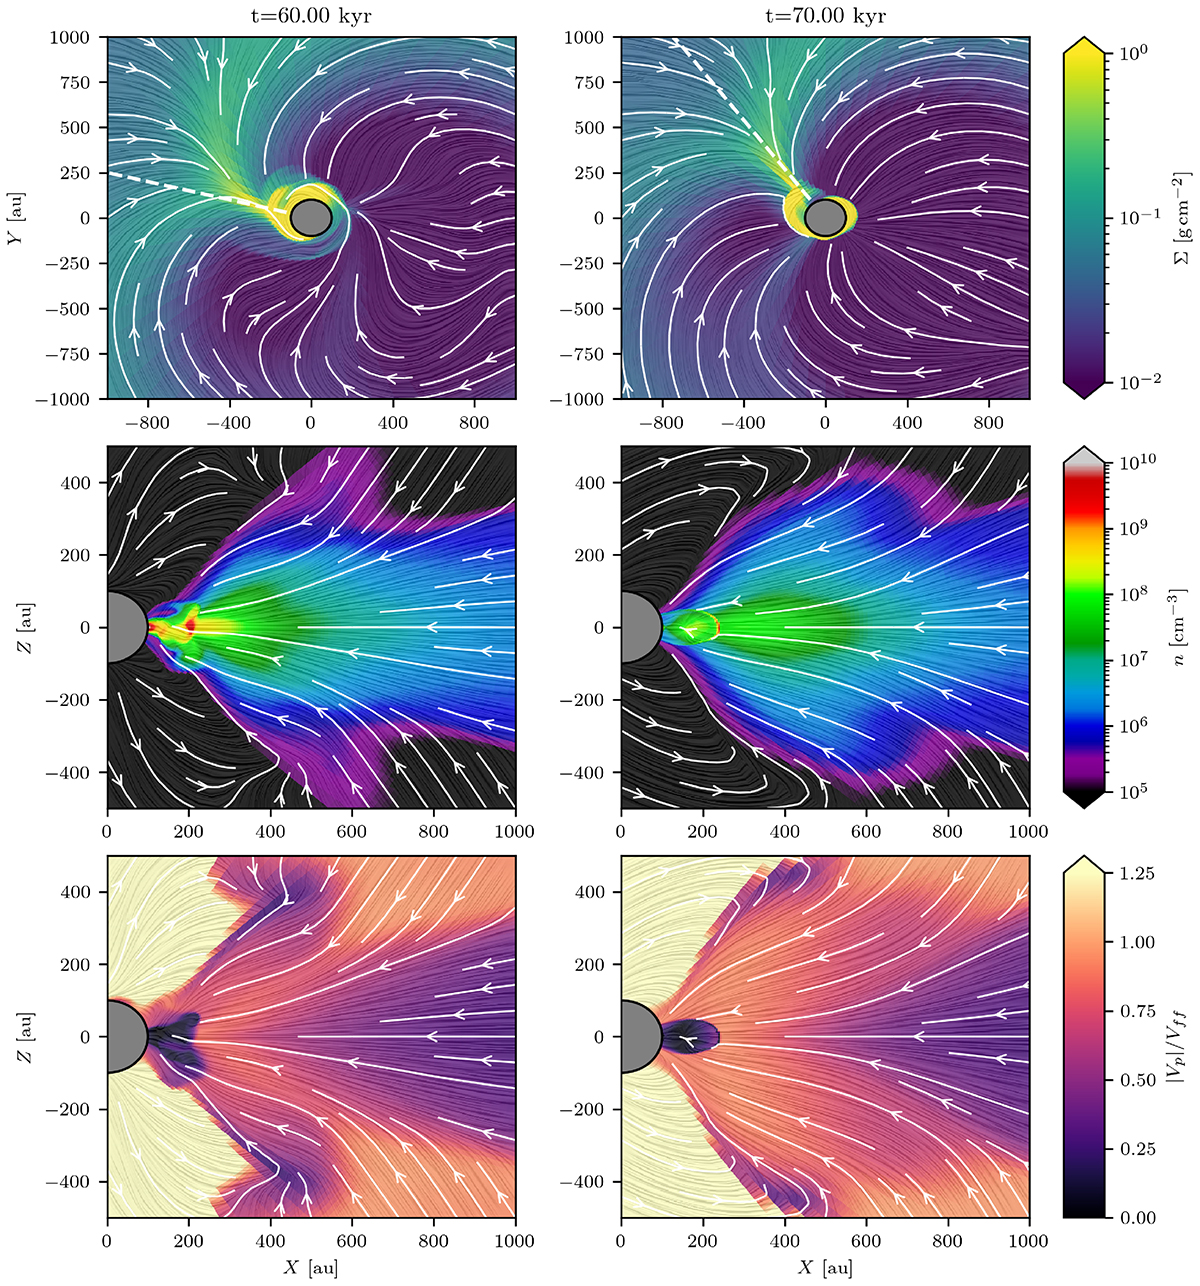
Top row: large-scale equatorial slice of the gas surface density with associated equatorial velocity flow (white quivers). A dashed white line indicates the azimuth of the main streamer, for which poloidal slices are performed. Middle row: large-scale poloidal slice of the gas particle density with associated poloidal velocity flow (white quivers). Bottom row: large-scale poloidal slice of the gas poloidal velocity, normalized by the free-fall velocity, with associated poloidal velocity flow (white quivers). Each column corresponds to a late time snapshot, respectively at 60 (left column) and 70 kyr (right column). In each plot, a line integrated convolution treatment is applied to emphasize the gas streamlines. The innermost 100 au are masked by a gray circle to allow for adequate contrast.
Current usage metrics show cumulative count of Article Views (full-text article views including HTML views, PDF and ePub downloads, according to the available data) and Abstracts Views on Vision4Press platform.
Data correspond to usage on the plateform after 2015. The current usage metrics is available 48-96 hours after online publication and is updated daily on week days.
Initial download of the metrics may take a while.