Open Access
Fig. 10.
Download original image
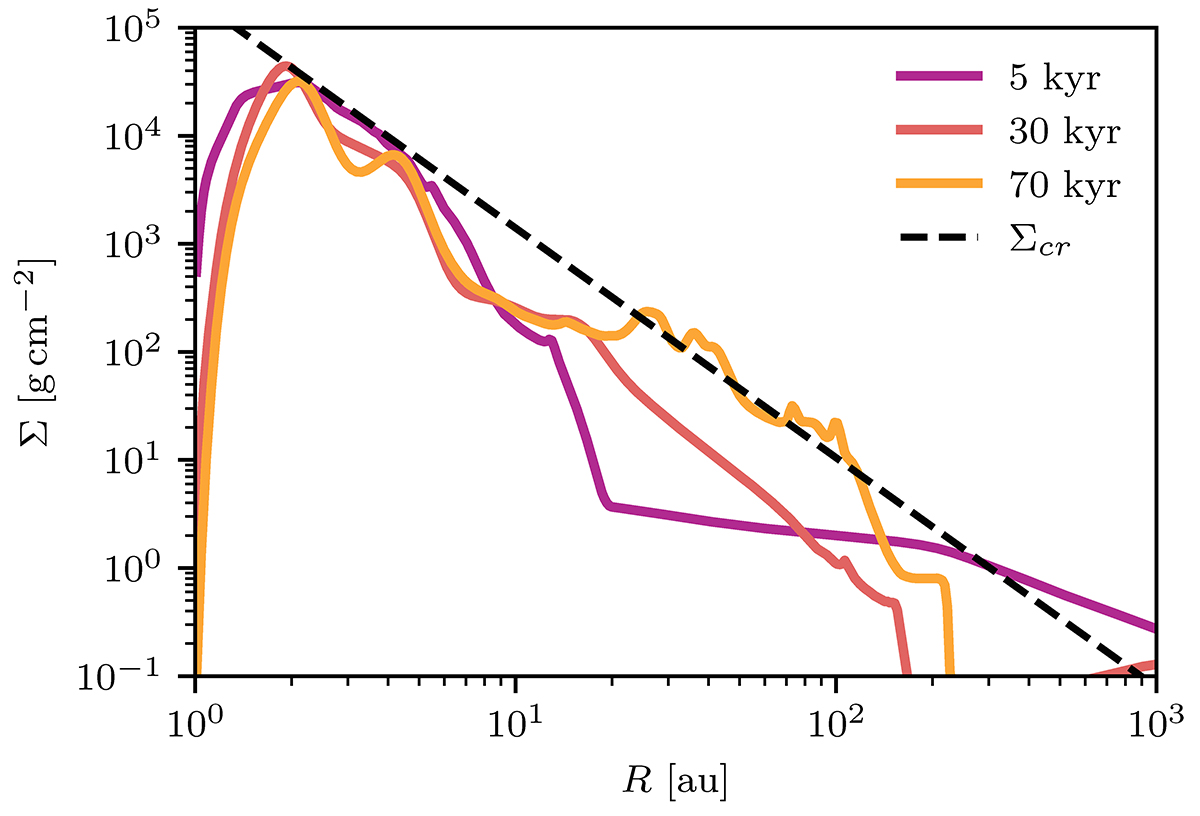
disk surface density versus the radius. Each color focuses on one accretion phase at 5, 30, and 70 kyr respectively. The lighter, the later. The dashed black line is the predicted critical surface density from Eq. (19).
Current usage metrics show cumulative count of Article Views (full-text article views including HTML views, PDF and ePub downloads, according to the available data) and Abstracts Views on Vision4Press platform.
Data correspond to usage on the plateform after 2015. The current usage metrics is available 48-96 hours after online publication and is updated daily on week days.
Initial download of the metrics may take a while.