Fig. 6
Download original image
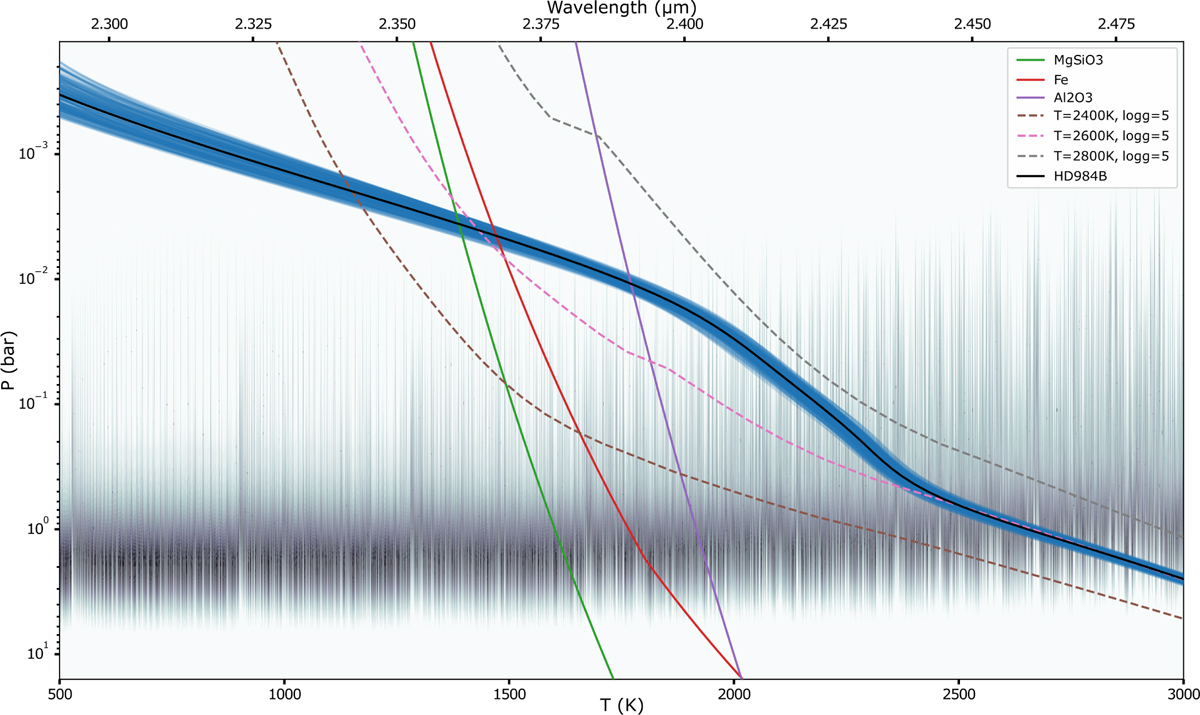
The P – T profile from our best-fit retrieval (model MgSiO3 + Fe). The best-fit profile is shown in black, and 200 random draws from the posterior are shown in blue. The condensation curves for different cloud species (MgSiO3, Fe and Al2O3) are also plotted. In addition, we show multiple Sonora P – T profiles as dashed lines (Marley et al. 2021) with similar properties as HD 984 B. Finally, we plot the emission contribution function (in wavelength, top axis) as contours, which quantifies the relative importance of the emission in a given pressure layer to the total at a given wavelength (Mollière et al. 2019).
Current usage metrics show cumulative count of Article Views (full-text article views including HTML views, PDF and ePub downloads, according to the available data) and Abstracts Views on Vision4Press platform.
Data correspond to usage on the plateform after 2015. The current usage metrics is available 48-96 hours after online publication and is updated daily on week days.
Initial download of the metrics may take a while.