Fig. 2
Download original image
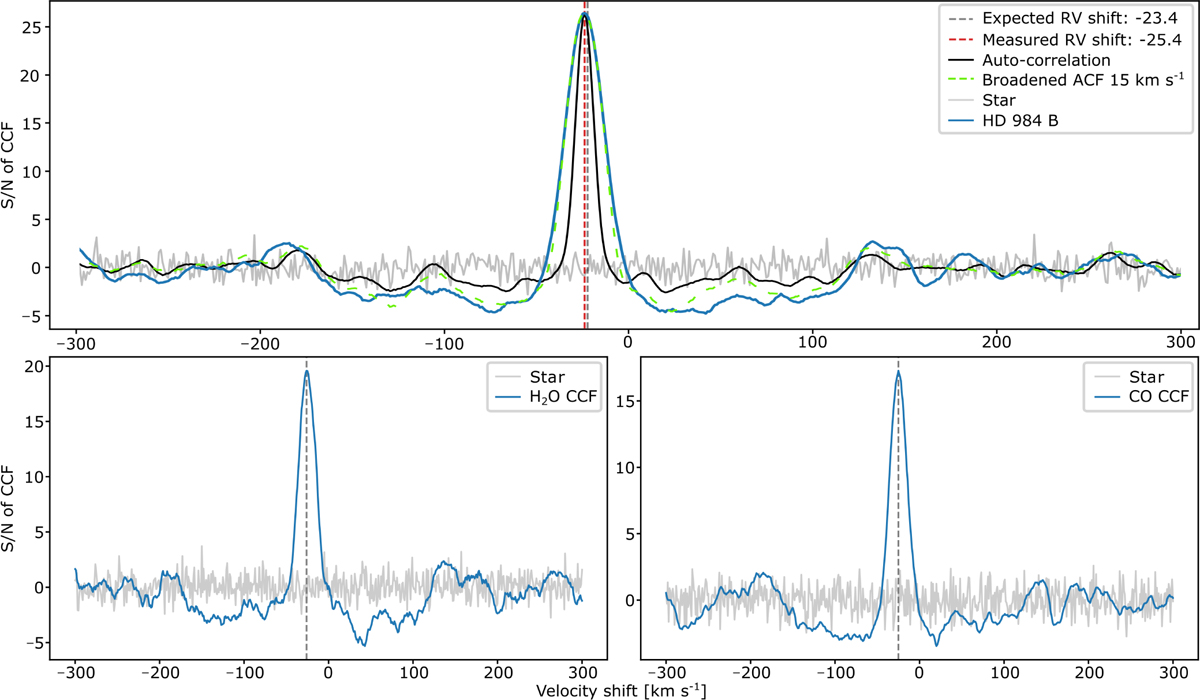
CCFs between the KPIC data (using the three orders from 2.29 to 2.49 μm) and different models. Top panel: CCFs between the KPIC data and a BT-Settl model (see Sect. 3.2). The CCF for HD 984 B is plotted in blue, and for comparison, we add the CCF of the stellar data in gray. The autocorrelation of the planetary model is also shown in black. The standard deviation of the wings of the CCF were used to estimate its noise and to normalize the CCF. The dashed vertical gray and red lines show the expected and measured RV of the companion (−23.4 km s−1 and −25.8 km s−1, respectively). Bottom panels: CCFs showing the H2O and CO detection from the same KPIC data after using single-molecule templates.
Current usage metrics show cumulative count of Article Views (full-text article views including HTML views, PDF and ePub downloads, according to the available data) and Abstracts Views on Vision4Press platform.
Data correspond to usage on the plateform after 2015. The current usage metrics is available 48-96 hours after online publication and is updated daily on week days.
Initial download of the metrics may take a while.