Fig. B.1
Download original image
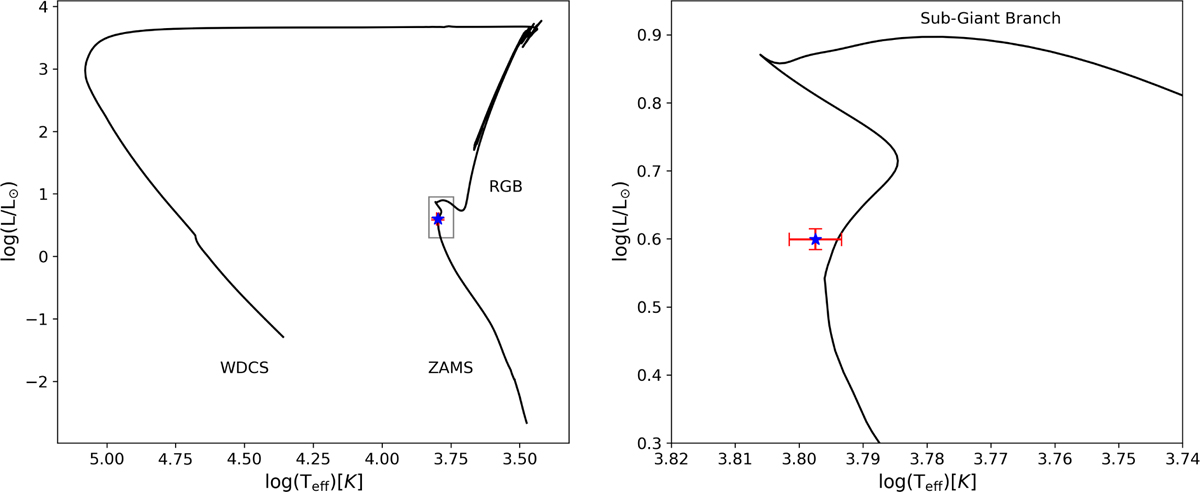
H-R diagram displaying the effective temperature Teff versus luminosity L/L⊙, the isochrone from the MESA Isochrone & Stellar Tracks (MIST) stellar evolution models is shown as a solid black line. The location of WASP-12 is shown with a filled blue star. The gray box marks the zoomed-in region shown in the right panel. Right: zoomed in view of the diagram.
Current usage metrics show cumulative count of Article Views (full-text article views including HTML views, PDF and ePub downloads, according to the available data) and Abstracts Views on Vision4Press platform.
Data correspond to usage on the plateform after 2015. The current usage metrics is available 48-96 hours after online publication and is updated daily on week days.
Initial download of the metrics may take a while.