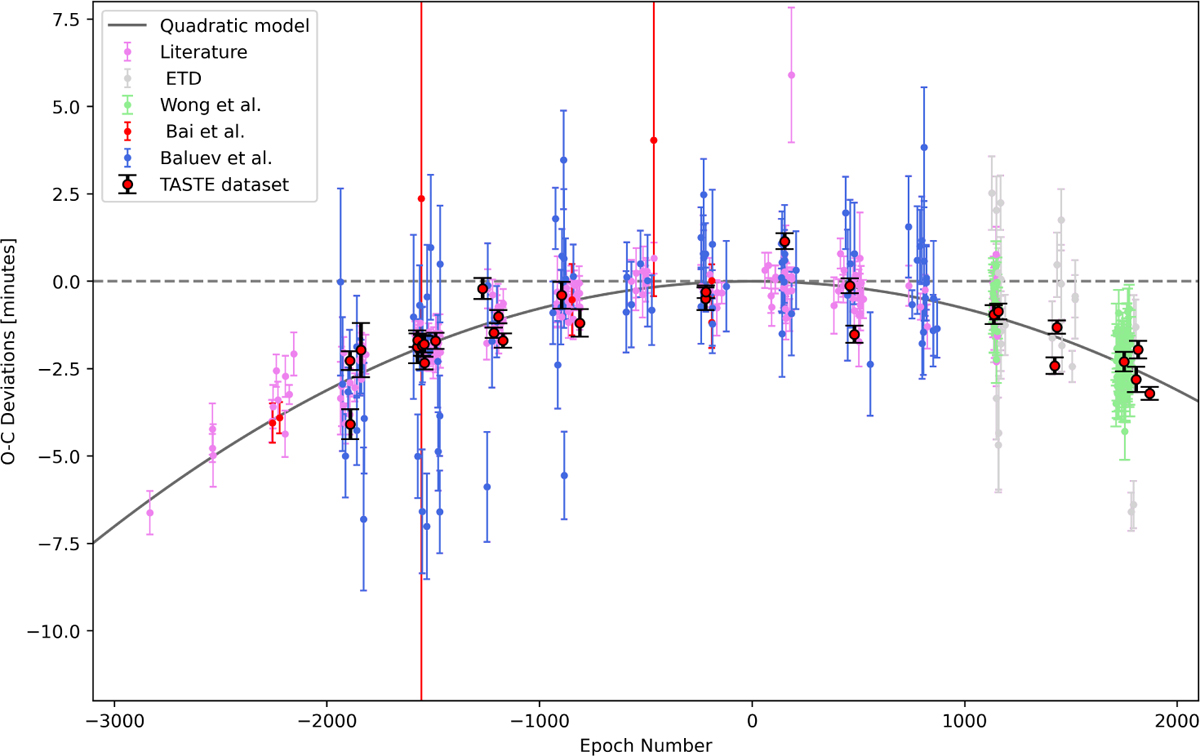
Fig. 2
Download original image
Observed minus calculated (O − C) diagram of WASP-12b for all the available transit-timing data. The reference ephemeris here is the linear part of Eq. (4), while the additional quadratic term (based on dP/dE) is plotted as a black solid line. The Asiago data are plotted as black and red points, the remaining points come from the literature: Bai et al. (2022) (red, including TESS), Wong et al. (2022) (light green), Baluev et al. (2019) (light blue), other literature works (pink, available at CDS). Amateur timings from ETD are plotted in gray.
Current usage metrics show cumulative count of Article Views (full-text article views including HTML views, PDF and ePub downloads, according to the available data) and Abstracts Views on Vision4Press platform.
Data correspond to usage on the plateform after 2015. The current usage metrics is available 48-96 hours after online publication and is updated daily on week days.
Initial download of the metrics may take a while.