Fig. A.3
Download original image
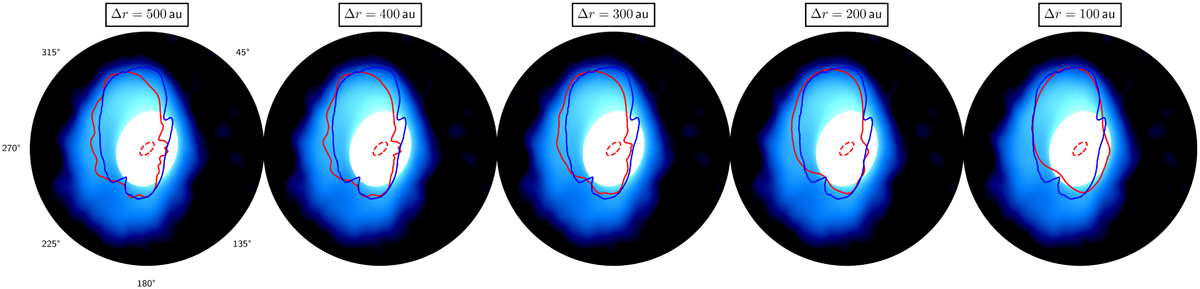
Comparison of normalized azimuthal profiles (red curves) for five different radial integration distances Δr based on run 5 at 150 kyr (corresponding to the synthetic ALMA observation shown in Fig. 5). The dashed red ellipse in the center of each plot shows the underlying assumed inner disk, whose properties were chosen according to those of the approximate ideal inner disk. The blue curves show ideal azimuthal profiles. Each red curve corresponds to the obtained normalized azimuthal profile of each plot, assuming the Δr value above the plot.
Current usage metrics show cumulative count of Article Views (full-text article views including HTML views, PDF and ePub downloads, according to the available data) and Abstracts Views on Vision4Press platform.
Data correspond to usage on the plateform after 2015. The current usage metrics is available 48-96 hours after online publication and is updated daily on week days.
Initial download of the metrics may take a while.