Open Access
Fig. A.1
Download original image
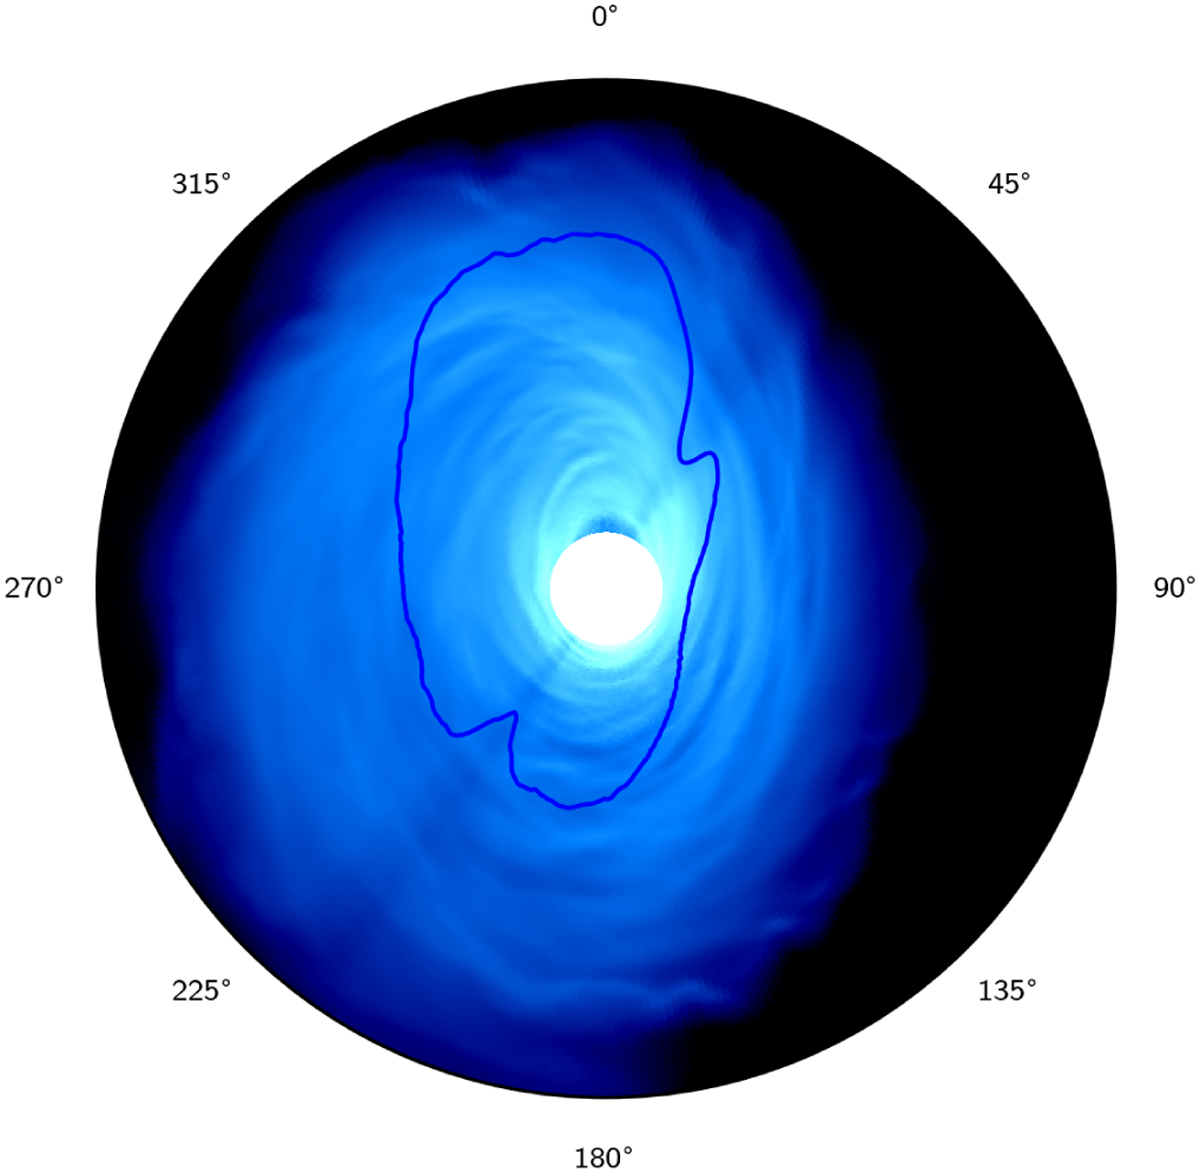
Ideal flux map at 850 μm based on run 5 at 150 kyr. The blue curve shows the corresponding azimuthal profile, which was obtained after masking the central circular white region.
Current usage metrics show cumulative count of Article Views (full-text article views including HTML views, PDF and ePub downloads, according to the available data) and Abstracts Views on Vision4Press platform.
Data correspond to usage on the plateform after 2015. The current usage metrics is available 48-96 hours after online publication and is updated daily on week days.
Initial download of the metrics may take a while.