Open Access
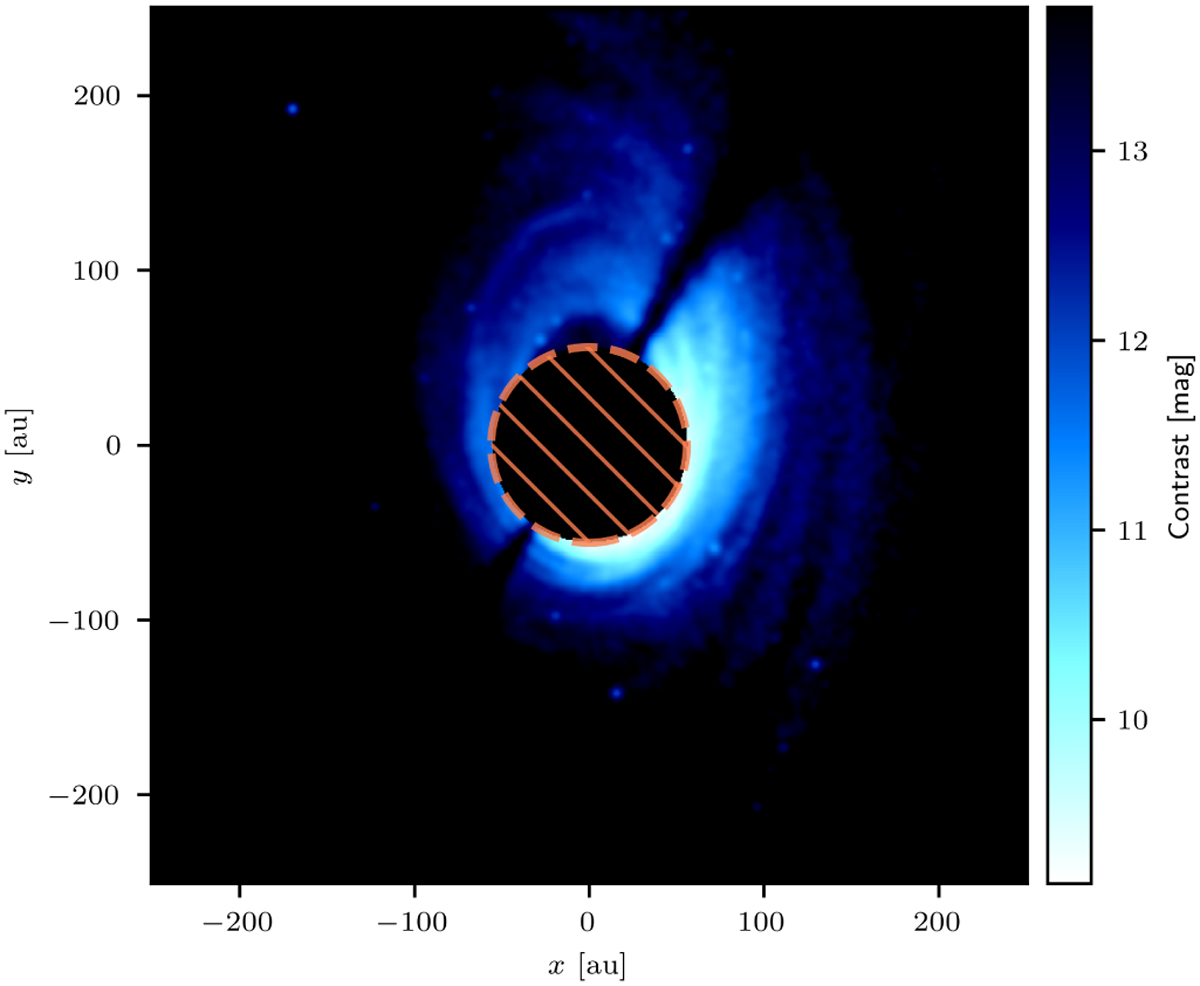
Fig. 2
Download original image
Contrast map corresponding to a synthetic observation at 1.245 μm based on run 5 at 150 kyr assuming a distance of 140 pc. For illustrative purposes, the hatched area of radius 400 mas in the center is masked and the color bar is limited to the maximum range of detectable contrast values outside the masked region.
Current usage metrics show cumulative count of Article Views (full-text article views including HTML views, PDF and ePub downloads, according to the available data) and Abstracts Views on Vision4Press platform.
Data correspond to usage on the plateform after 2015. The current usage metrics is available 48-96 hours after online publication and is updated daily on week days.
Initial download of the metrics may take a while.