Fig. 1
Download original image
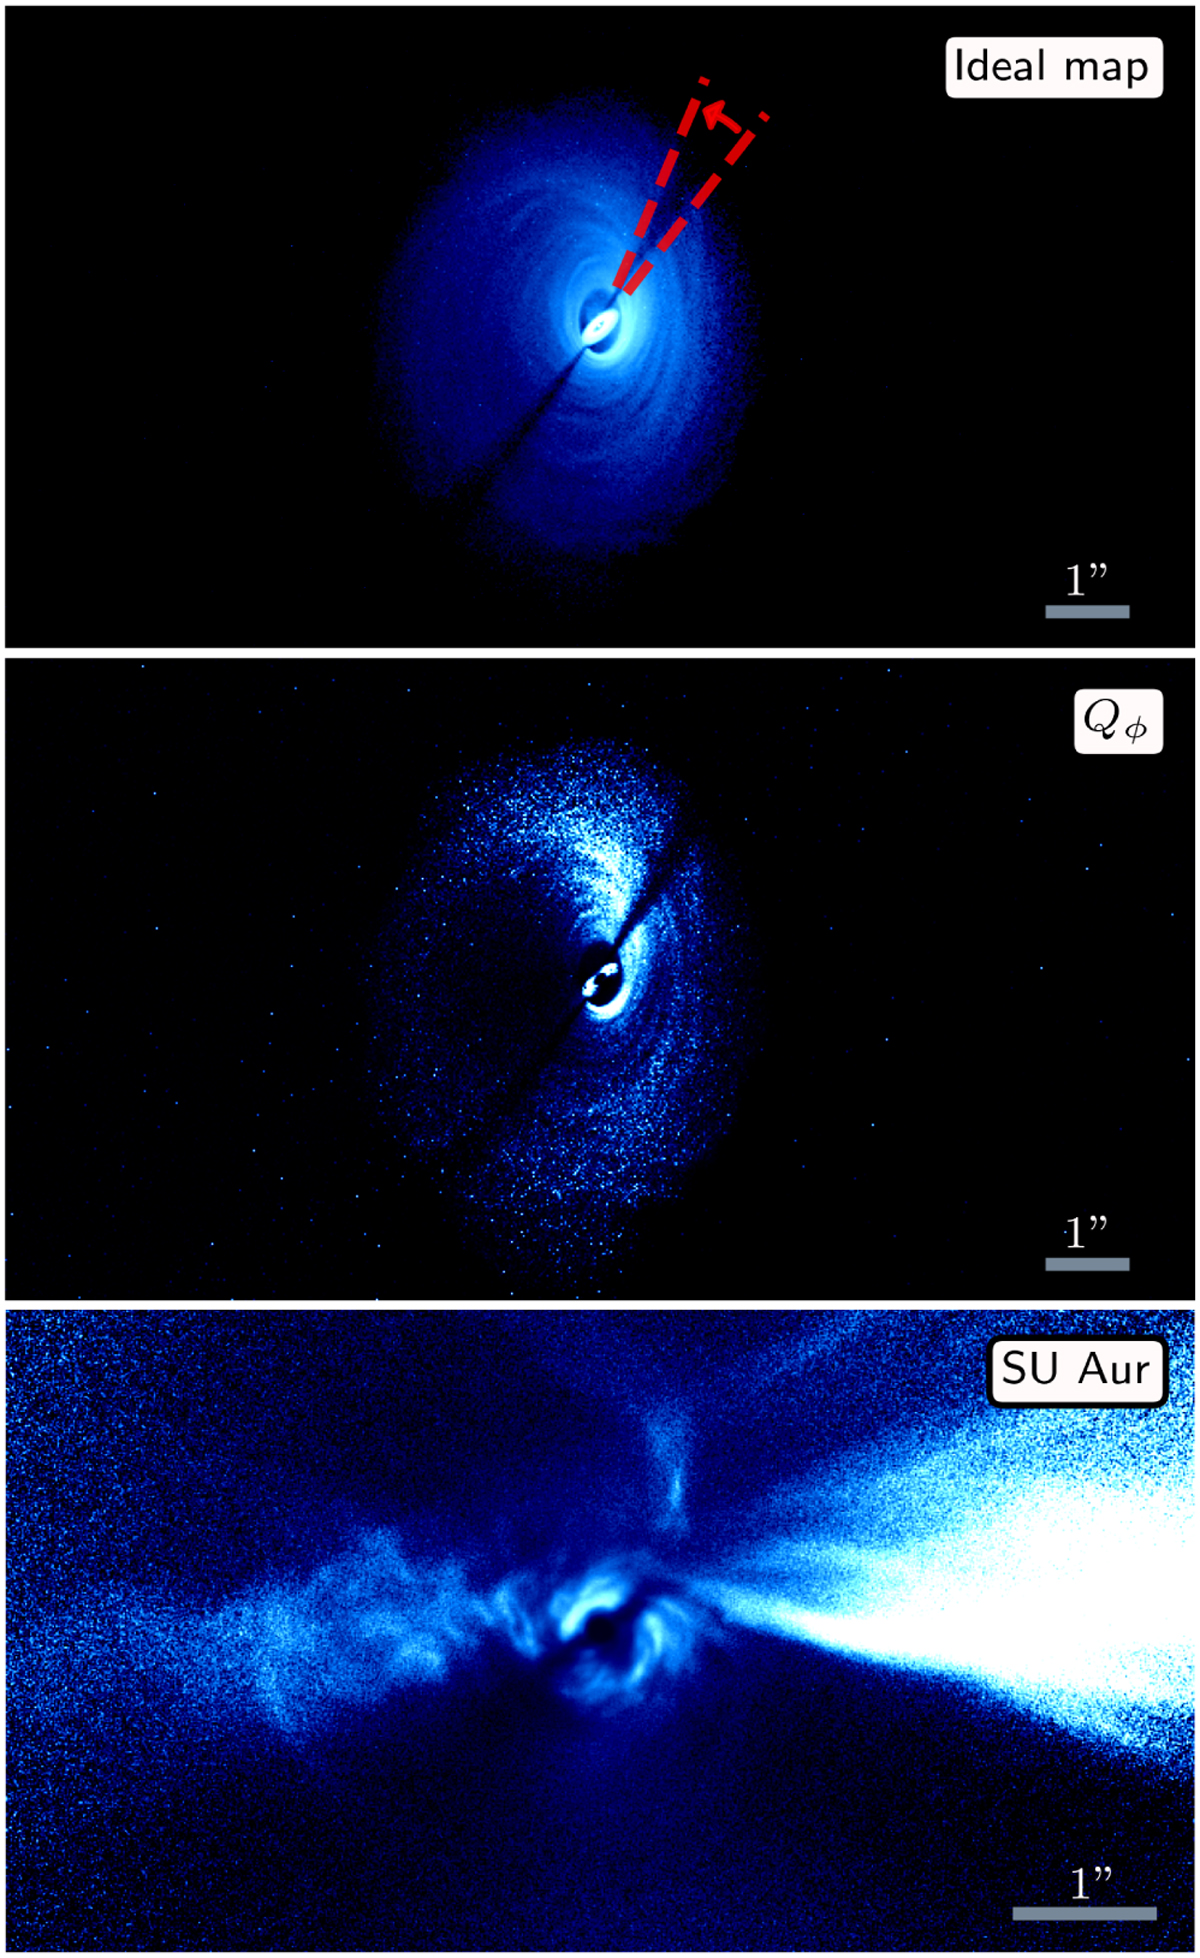
Ideal flux map at 1.245 μm for run 5 at 150 kyr assuming a distance of 140 pc (top). Red lines highlight the shadow feature and its opening angle in the upper right quadrant of the image. Corresponding ideal Qϕ map (middle). For illustrative purposes, r2-normalization is applied to the image to better highlight the regions far from the central star. SPHERE/IRDIS H band Qϕ observation (bottom) of the SU Aur system (Ginski et al. 2021).
Current usage metrics show cumulative count of Article Views (full-text article views including HTML views, PDF and ePub downloads, according to the available data) and Abstracts Views on Vision4Press platform.
Data correspond to usage on the plateform after 2015. The current usage metrics is available 48-96 hours after online publication and is updated daily on week days.
Initial download of the metrics may take a while.