Fig. 8
Download original image
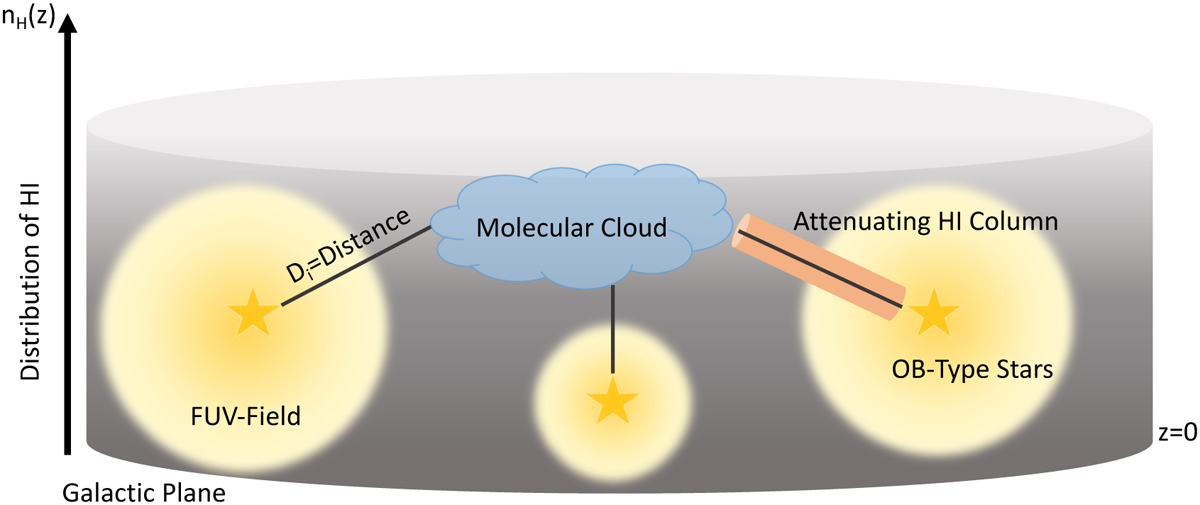
Schematic illustration of the method to derive the FUV field at each source. The gray cylinder indicates the hydrogen distribution with respect to the galactic height ɀ. The yellow stars indicate the 3D stellar distribution in the Milky Way. The solid black lines originating from the stars indicate the distance from the star to the source. The yellow halo around the star illustrates the FUV field generated by each star. The orange cylinder placed along the path between the star and the source shows schematically the hydrogen column which attenuates the FUV field.
Current usage metrics show cumulative count of Article Views (full-text article views including HTML views, PDF and ePub downloads, according to the available data) and Abstracts Views on Vision4Press platform.
Data correspond to usage on the plateform after 2015. The current usage metrics is available 48-96 hours after online publication and is updated daily on week days.
Initial download of the metrics may take a while.