Fig. 5
Download original image
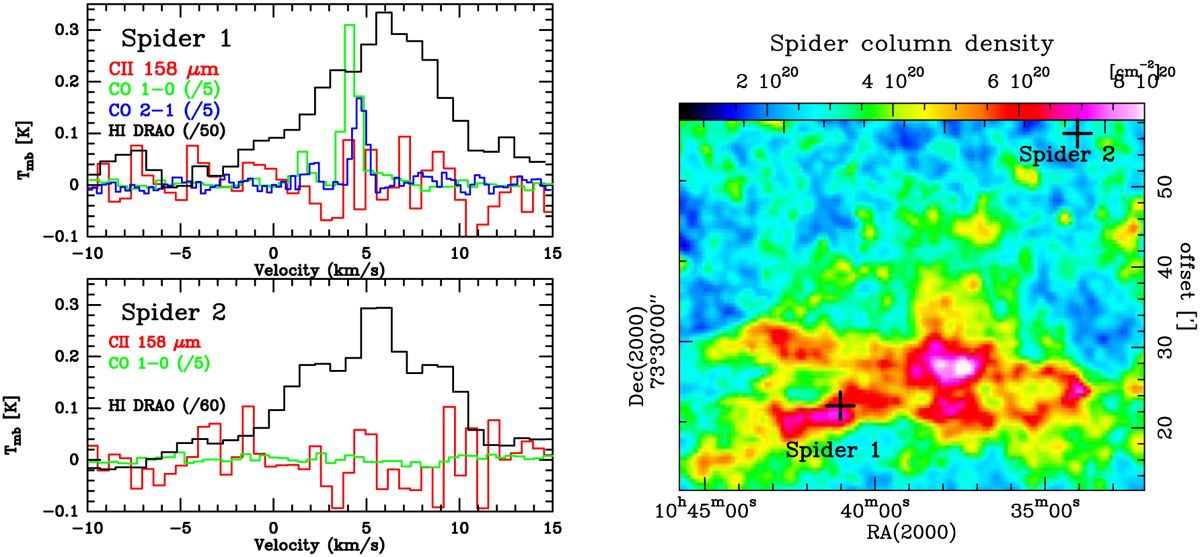
Spectra and column density map of Spider. Right panel: Herschel hydrogen column density map derived from dust in color in which the observed [C II] positions are indicated with black crosses. Left panels: Spectra of the [C II] 158 µm, CO, and H I (DRAO) lines, all at ~1′ resolution. We note that some line intensities were reduced for better visibility.
Current usage metrics show cumulative count of Article Views (full-text article views including HTML views, PDF and ePub downloads, according to the available data) and Abstracts Views on Vision4Press platform.
Data correspond to usage on the plateform after 2015. The current usage metrics is available 48-96 hours after online publication and is updated daily on week days.
Initial download of the metrics may take a while.