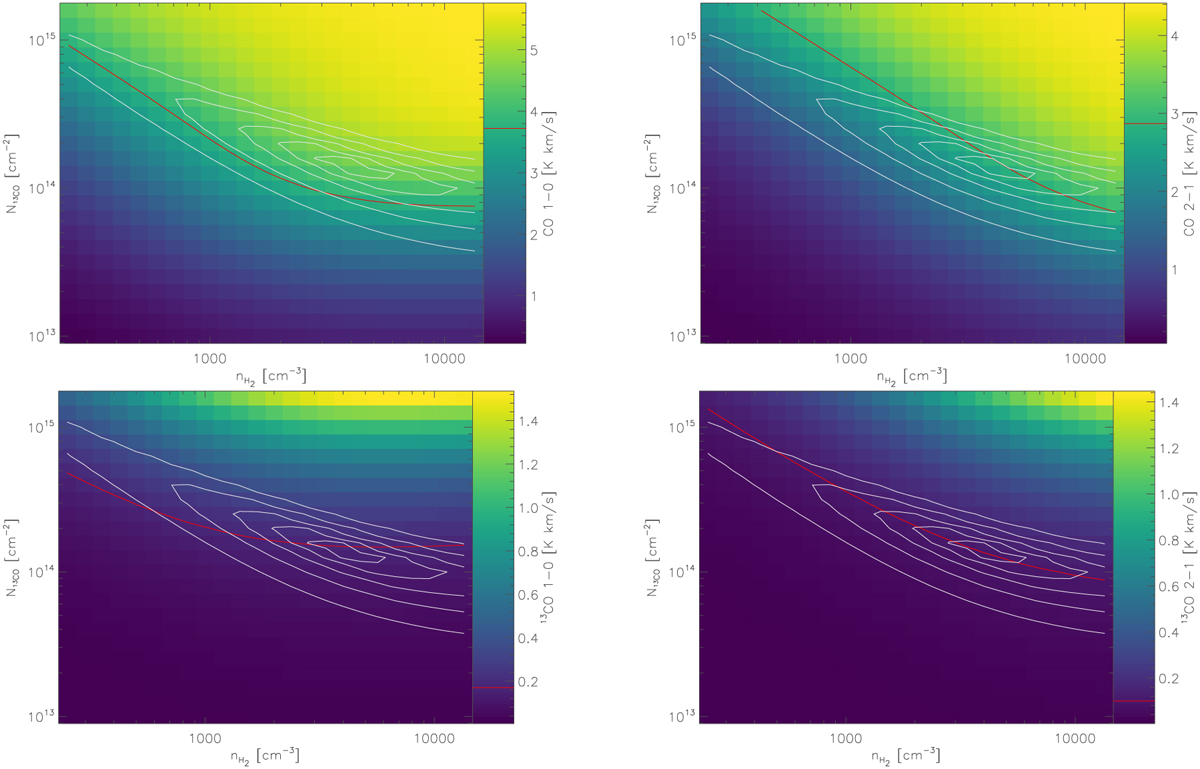
Fig. 11
Download original image
Visualization of the RADEX fit to the four CO and 13CO lines at the F1 position in Draco. Each plot shows a constant temperature cut through the three dimensional distribution of line intensities and χ2 values. The kinetic temperature of the χ2 minimum, that is, 9 K (see Table 8) was used. The colors in the plot show the integrated line intensities for the four lines, the observed value is marked by a red line. The gray contours give χ2 values of 8, 16, 32, 64, and 128. As the χ2 distribution is a global property, those contours are the same in all four subplots.
Current usage metrics show cumulative count of Article Views (full-text article views including HTML views, PDF and ePub downloads, according to the available data) and Abstracts Views on Vision4Press platform.
Data correspond to usage on the plateform after 2015. The current usage metrics is available 48-96 hours after online publication and is updated daily on week days.
Initial download of the metrics may take a while.