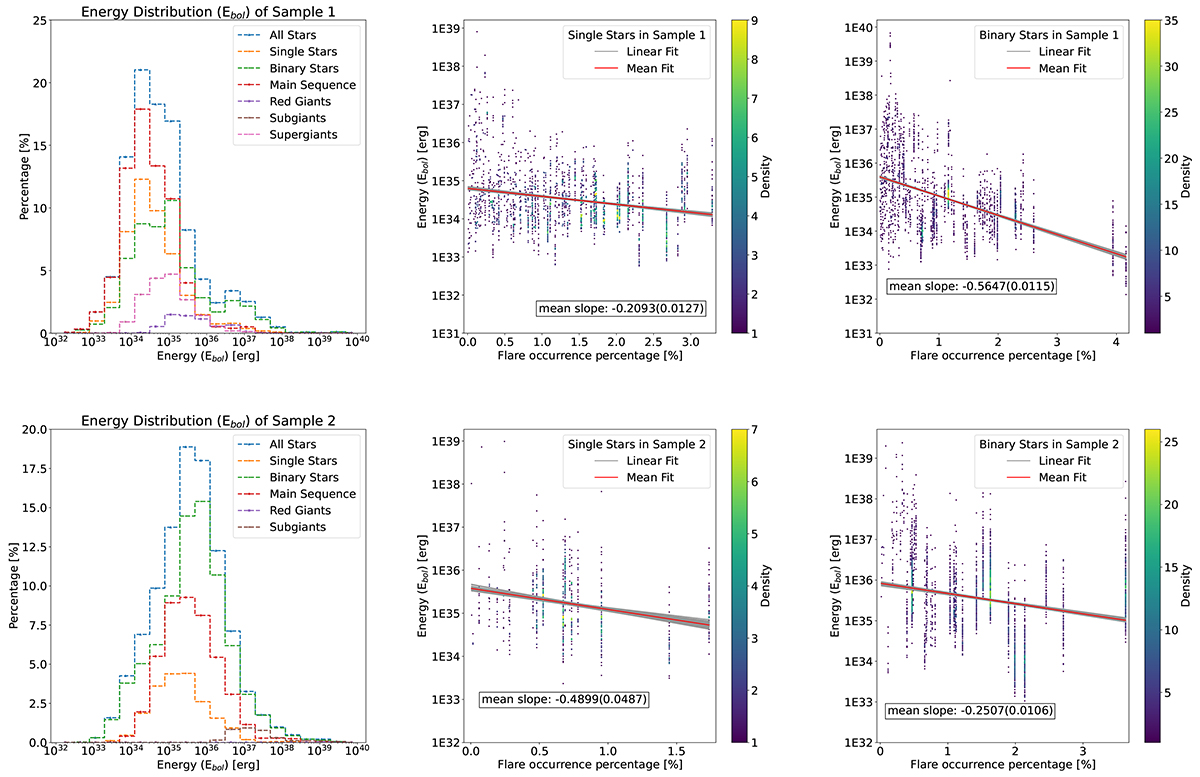
Fig. 9.
Download original image
Bolometric flare energy distribution and relationship between bolometric flare energy and flare occurrence percentage. The left panels illustrate the percentage of bolometric flare energy in different energy ranges, where different colors represent the distribution of different types of stars in the small panel. The middle and right panels show the relationship between flare energy and flare occurrence percentage for single and binary stars, respectively. For both samples, all the mean linear slopes are less than zero, which indicates that flare energy decreases as flare occurrence rates increase for both single and binary stars.
Current usage metrics show cumulative count of Article Views (full-text article views including HTML views, PDF and ePub downloads, according to the available data) and Abstracts Views on Vision4Press platform.
Data correspond to usage on the plateform after 2015. The current usage metrics is available 48-96 hours after online publication and is updated daily on week days.
Initial download of the metrics may take a while.