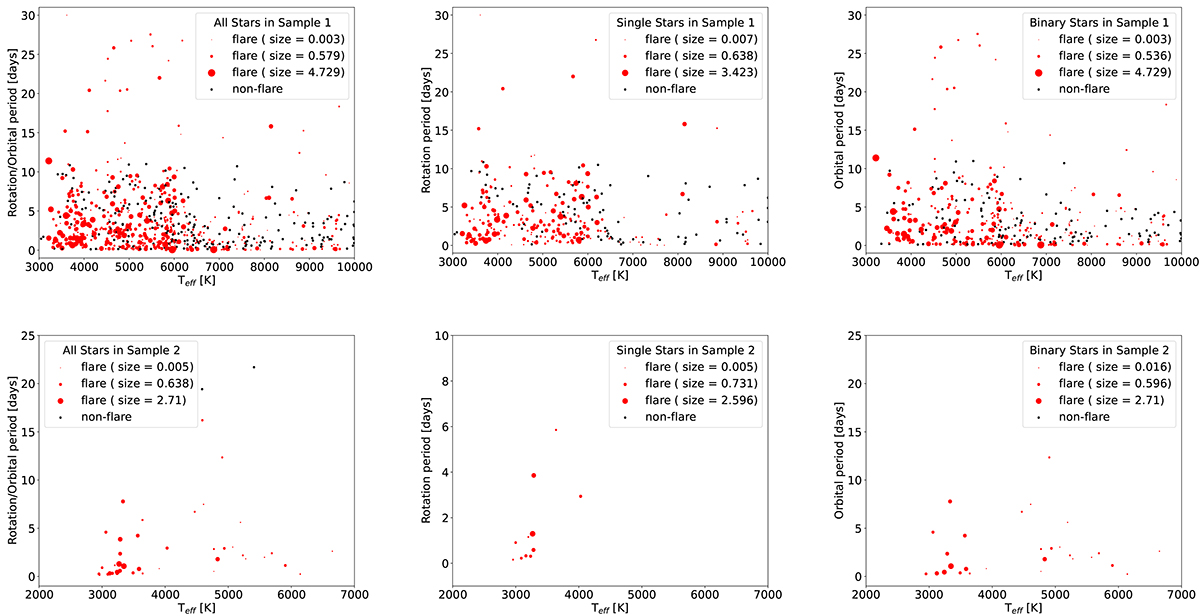
Fig. 8.
Download original image
Flare occurrence percentages of all radio stars (left), single stars (middle), and binary stars (right) in the two dimensions of effective temperature and period (rotation or orbital) for both samples, where the size of the red circles represents the value of the flare occurrence percentage. The majority of flaring stars with higher flare occurrence percentage are distributed within smaller ranges of effective temperature.
Current usage metrics show cumulative count of Article Views (full-text article views including HTML views, PDF and ePub downloads, according to the available data) and Abstracts Views on Vision4Press platform.
Data correspond to usage on the plateform after 2015. The current usage metrics is available 48-96 hours after online publication and is updated daily on week days.
Initial download of the metrics may take a while.