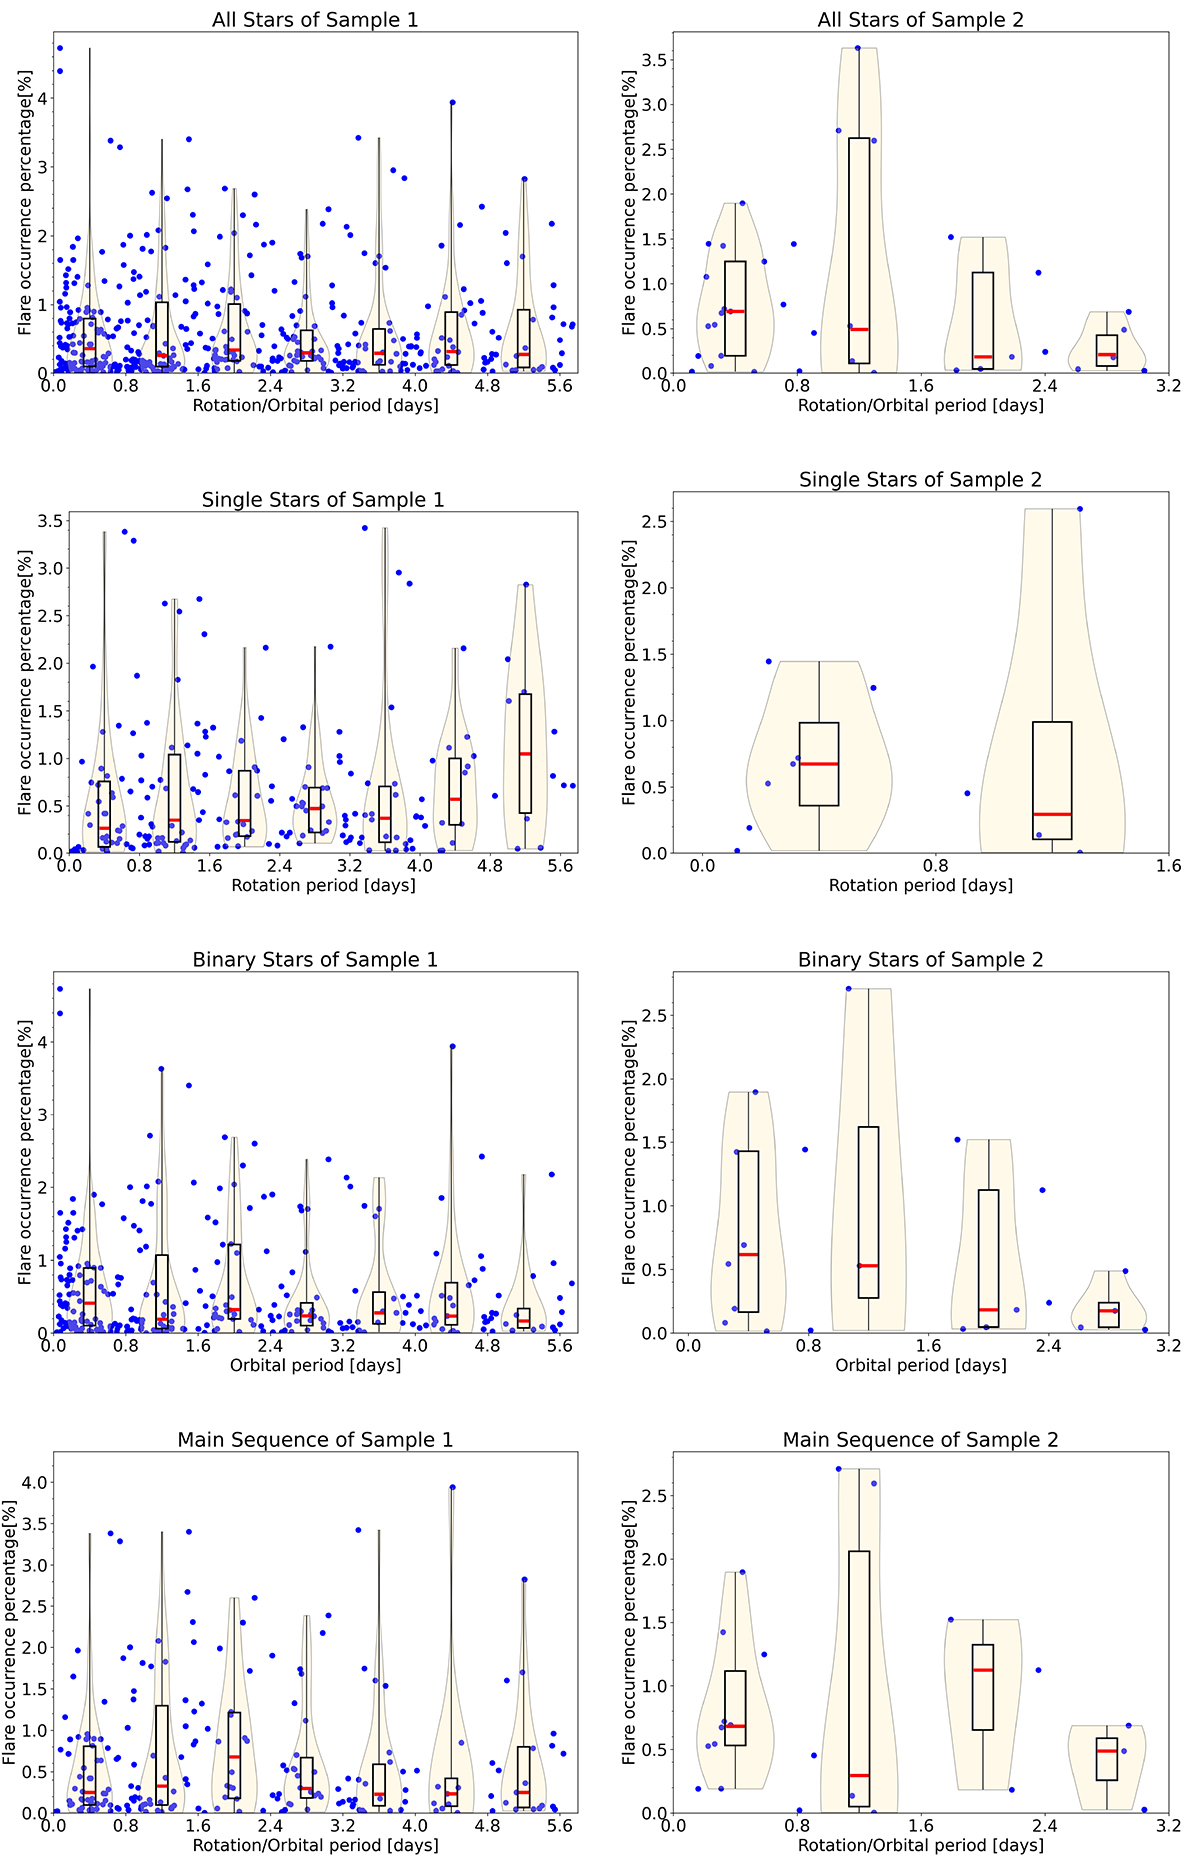
Fig. 7.
Download original image
Distribution of flare occurrence percentages with rotation or orbital period in Samples 1 and 2. In each panel, blue dots represent the rotation or orbital periods and flare occurrence percentage for each star. We overlaid violin plots with box-and-whiskers plots on each scatter plot to reflect the trend of the scatter plot. For Sample 1, there no obvious correlation observed while for Sample 2 both all stars and binary stars show a trend where the flare occurrence percentage decreases with increasing rotation or orbital period.
Current usage metrics show cumulative count of Article Views (full-text article views including HTML views, PDF and ePub downloads, according to the available data) and Abstracts Views on Vision4Press platform.
Data correspond to usage on the plateform after 2015. The current usage metrics is available 48-96 hours after online publication and is updated daily on week days.
Initial download of the metrics may take a while.