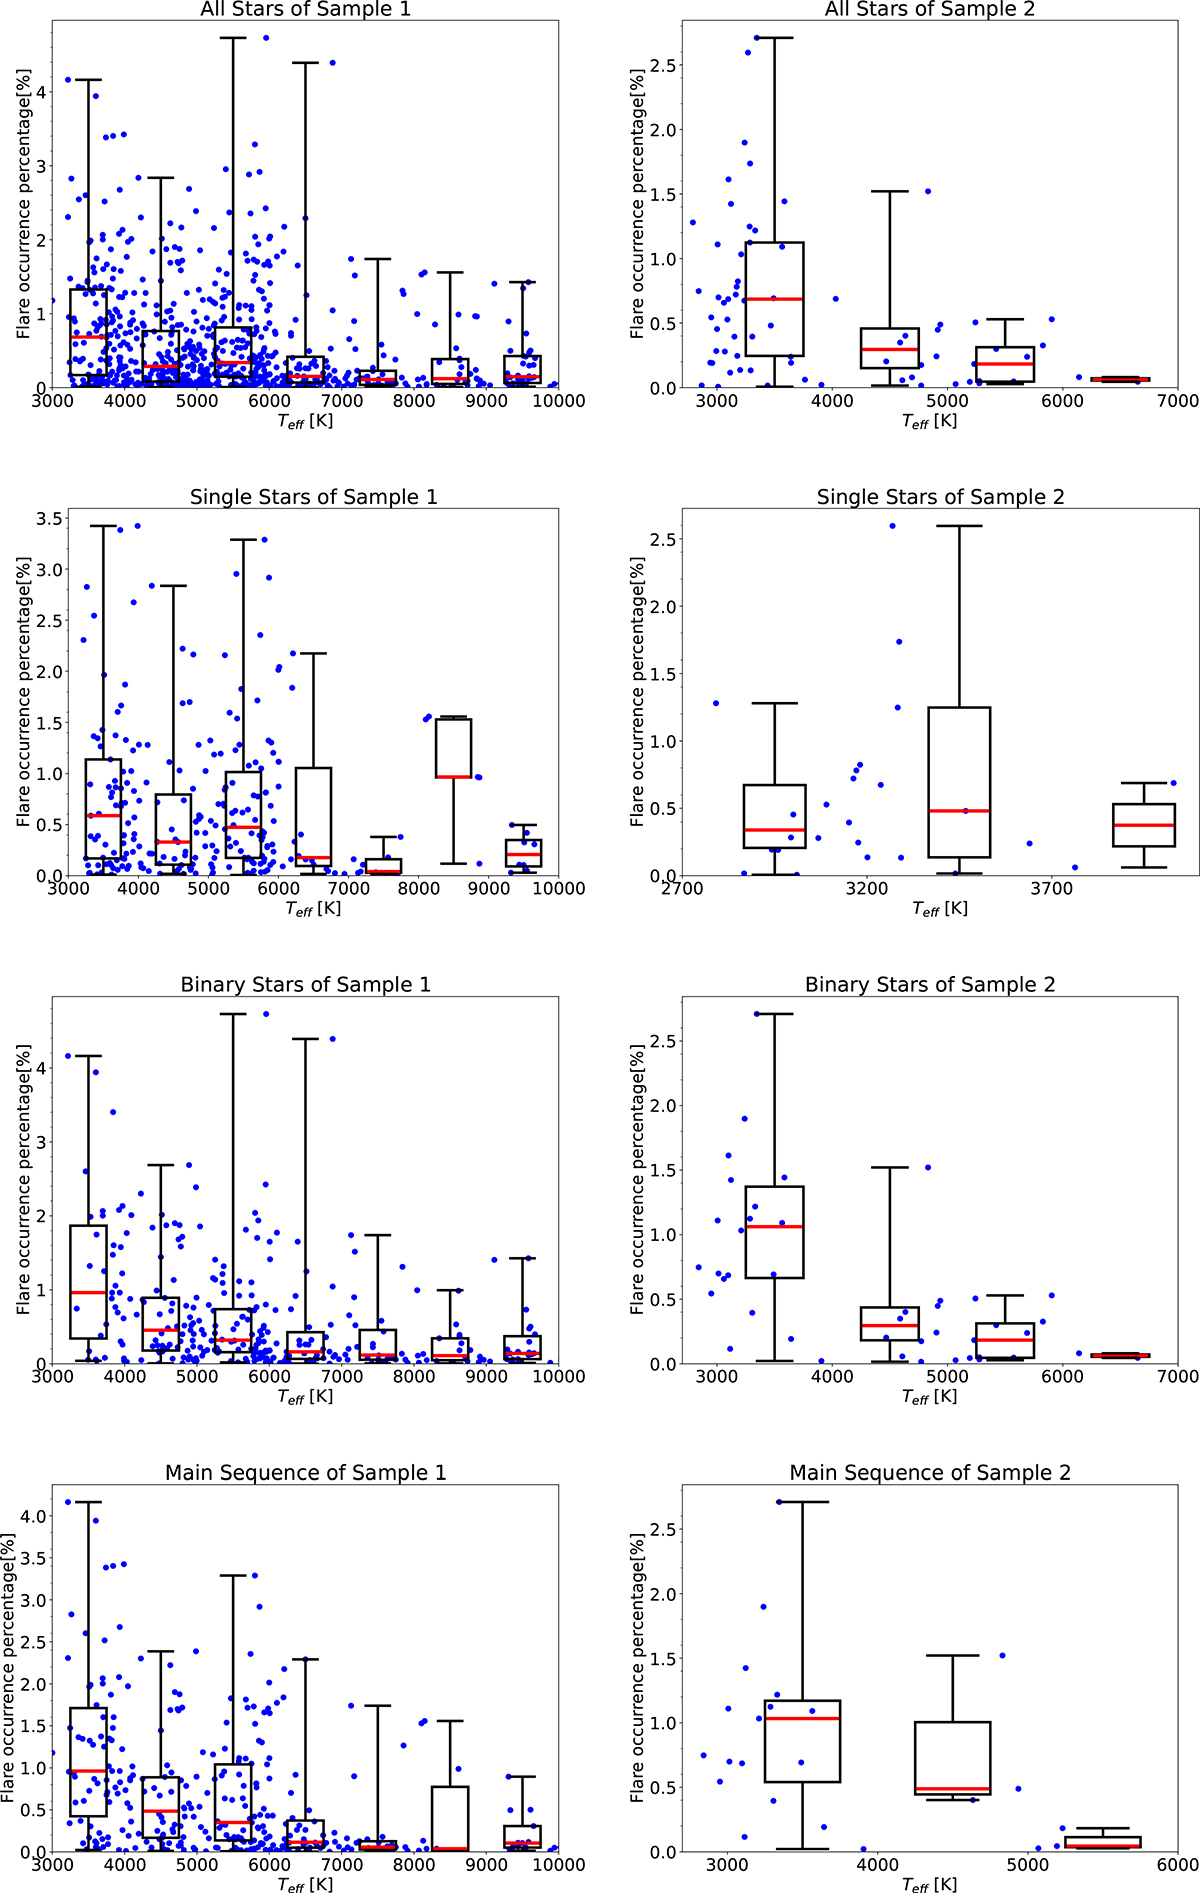
Fig. 6.
Download original image
Distribution of flare occurrence percentages with effective temperature in Sample 1 and Sample 2. In each panel, blue dots represent the effective temperature and flare occurrence percentage for each star. We overlaid box-and-whiskers plots on each scatter plot to reflect the trend of the scatter plot. In the left four panels corresponding to Sample 1 classifications, the flare occurrence percentage decreases with increasing effective temperature. Similarly, in the right four panels corresponding to Sample 2, except for the single star classification, where the trend observed in Sample 1 is not evident due to a smaller sample size, the other classifications exhibit the same pattern: the flare occurrence percentage decreases with increasing effective temperature.
Current usage metrics show cumulative count of Article Views (full-text article views including HTML views, PDF and ePub downloads, according to the available data) and Abstracts Views on Vision4Press platform.
Data correspond to usage on the plateform after 2015. The current usage metrics is available 48-96 hours after online publication and is updated daily on week days.
Initial download of the metrics may take a while.