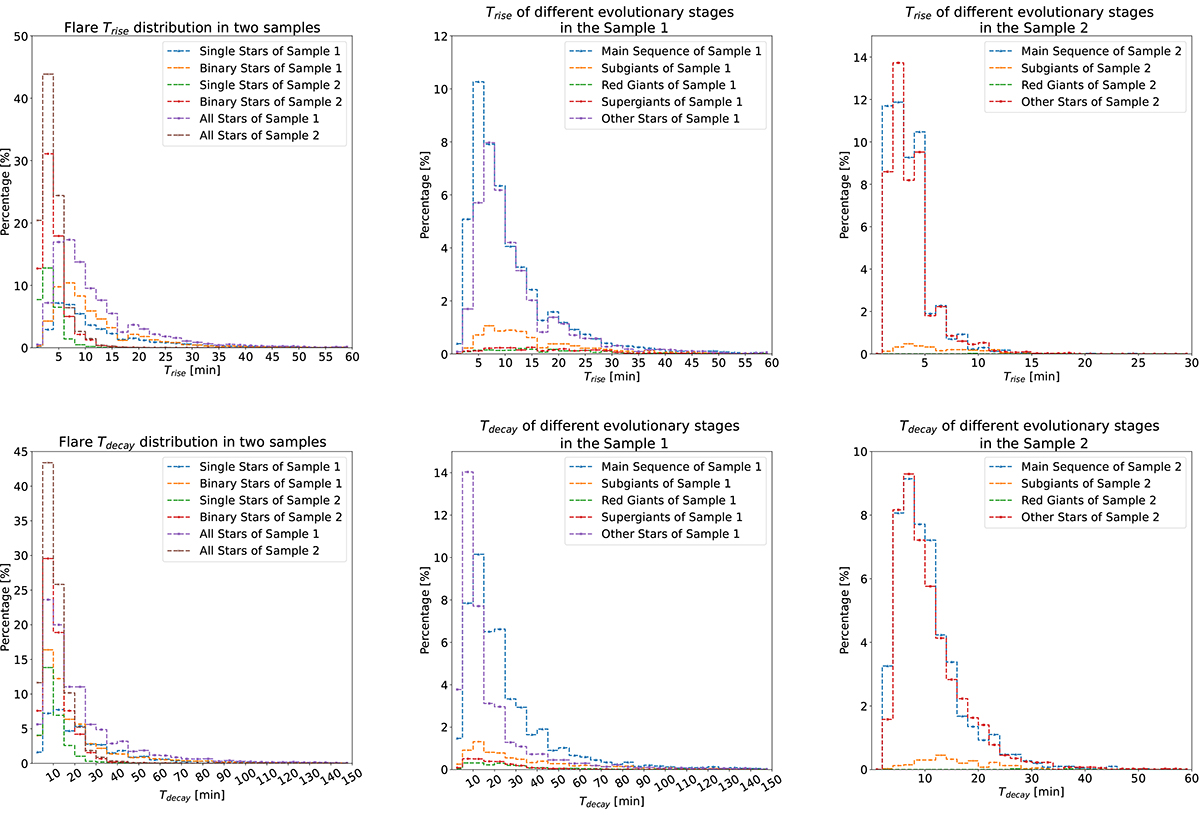
Fig. 5.
Download original image
Distribution of the flare percentage in different intervals of the flare rise and decay times, respectively. For each panel, we used different colors coupled with different markers to represent different classifications and provide explanations in the legend. The left panel is the distribution of the flare percentage versus the different rise and decay time ranges for all flares, single stars, and binary stars. The middle and right panels show the distribution of the different evolutionary stages for Samples 1 and 2. The rise time of flares in Sample 1 is mostly less than 20 min, while in Sample 2, the majority of flares have rise times of less than 10 min. The flare decay times in Sample 1 are mostly less than 40 min, while in Sample 2, they are mostly less than 20 min.
Current usage metrics show cumulative count of Article Views (full-text article views including HTML views, PDF and ePub downloads, according to the available data) and Abstracts Views on Vision4Press platform.
Data correspond to usage on the plateform after 2015. The current usage metrics is available 48-96 hours after online publication and is updated daily on week days.
Initial download of the metrics may take a while.