Fig. 4.
Download original image
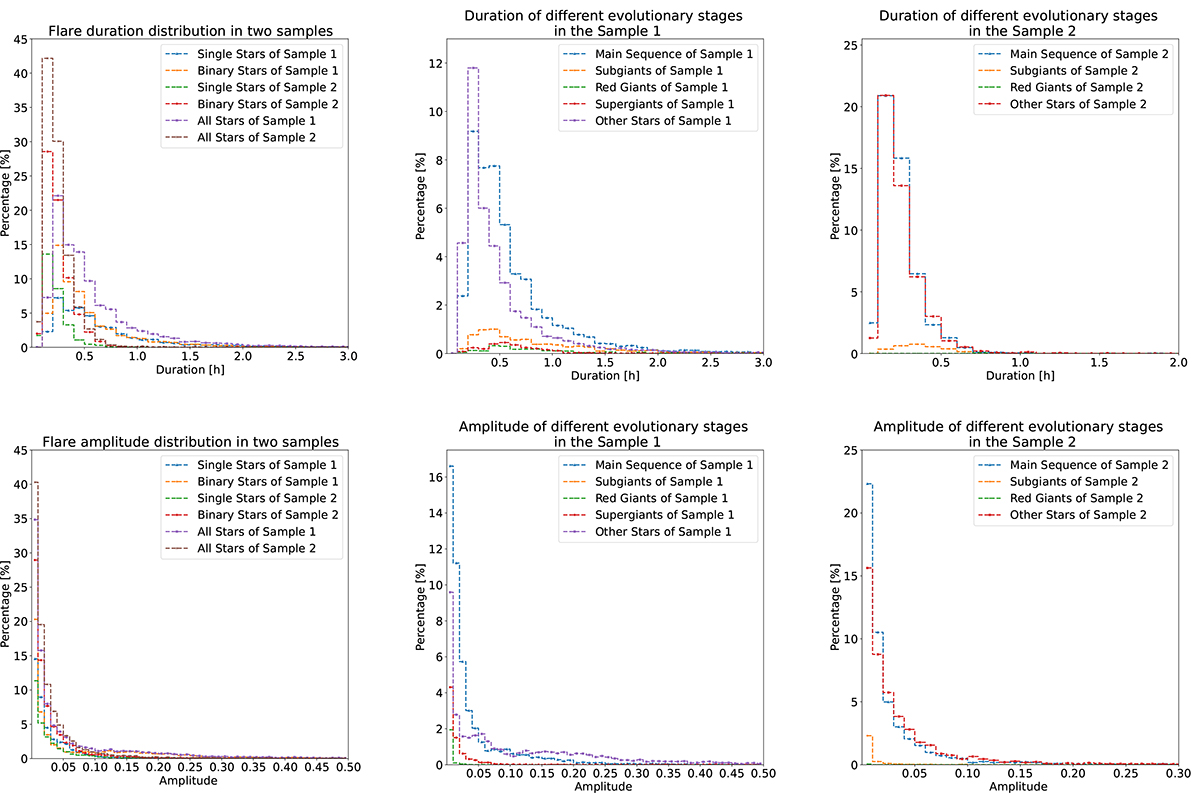
Distribution of the percentage of flares in different intervals of the duration and amplitude, respectively. For each panel, we use different colors coupled with different markers to represent different classifications and provide explanations in the legend. The durations of most flares is less than 1 h in Sample 1, while for Sample 2, the duration of most flares is less than 0.5 hour. The amplitude of most flares is less than 0.05 for both samples. For Samples 1 and 2, the distribution of flares in different duration or amplitude ranges is dominated by main sequence stars.
Current usage metrics show cumulative count of Article Views (full-text article views including HTML views, PDF and ePub downloads, according to the available data) and Abstracts Views on Vision4Press platform.
Data correspond to usage on the plateform after 2015. The current usage metrics is available 48-96 hours after online publication and is updated daily on week days.
Initial download of the metrics may take a while.