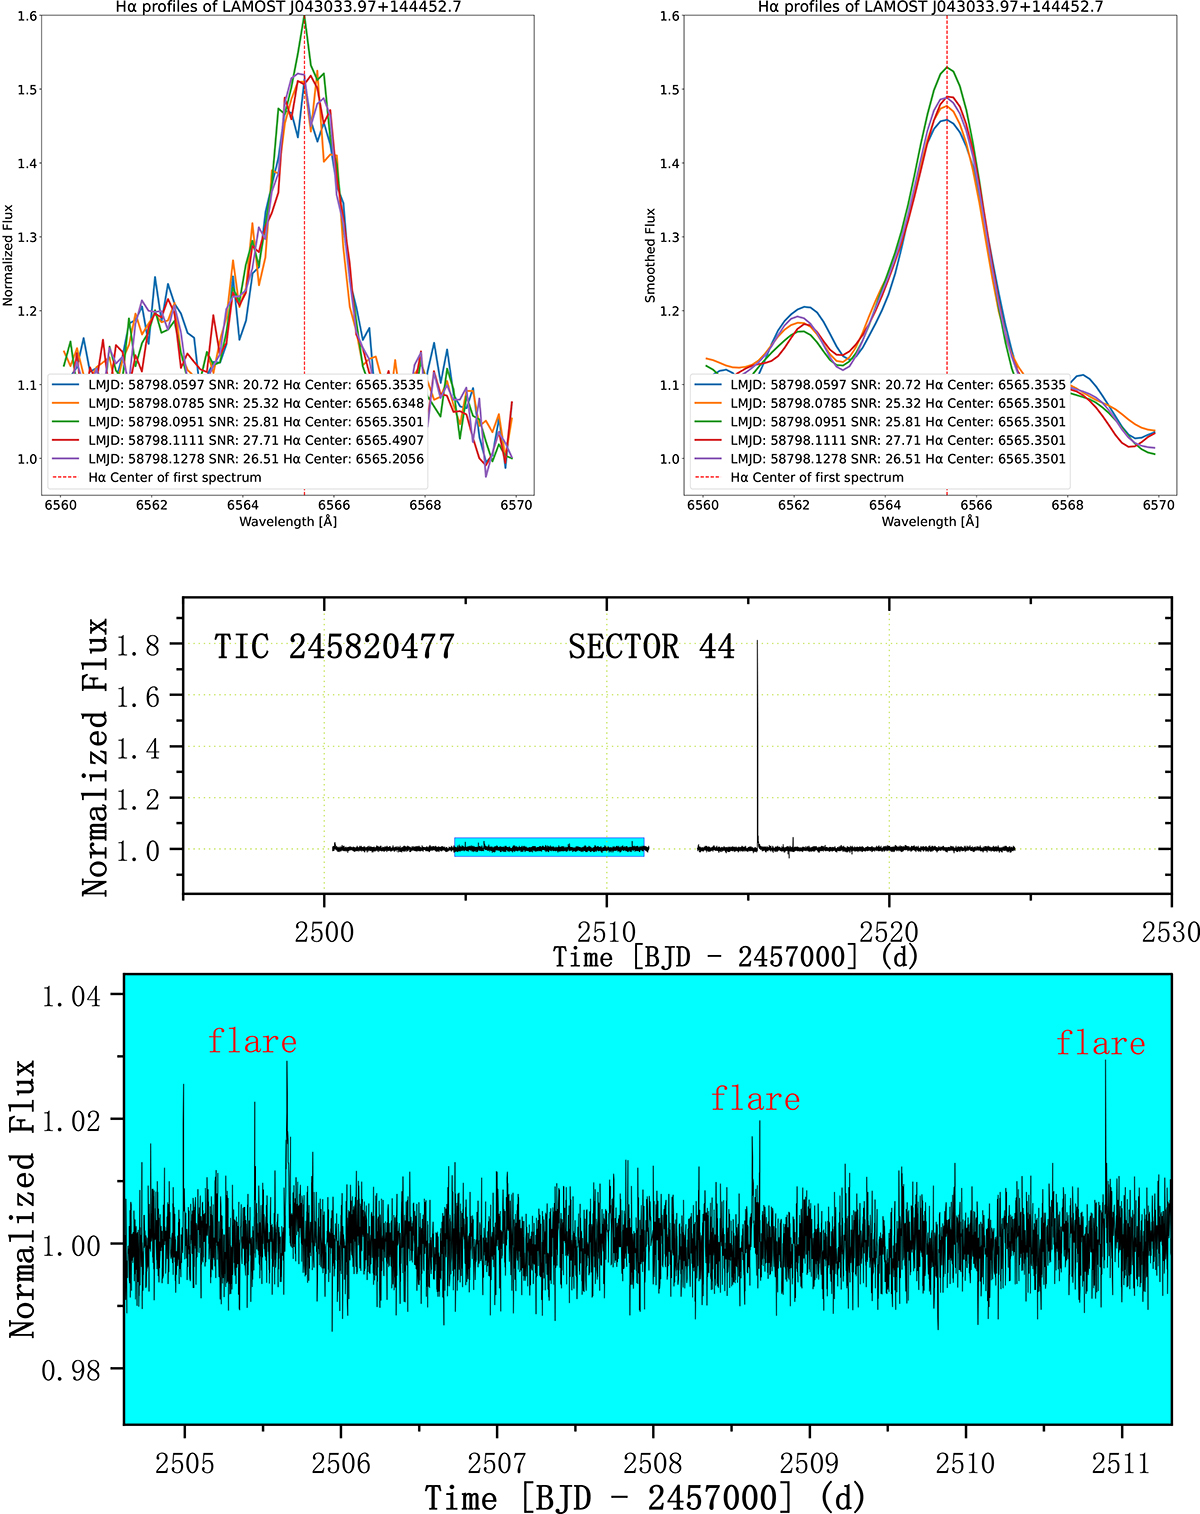
Fig. 16.
Download original image
Photometric and spectroscopic images for TIC 245820477. The top two panels have similar contents to the top two panels (left and middle) of Fig. 15. The middle and bottom panels are the light curve of TIC 245820477 SECTOR 44 and the magnification of the blue area. From the magnified section of the light curve, several minor flares can be seen, which may be the cause of the slight blue shift in the Hα lines.
Current usage metrics show cumulative count of Article Views (full-text article views including HTML views, PDF and ePub downloads, according to the available data) and Abstracts Views on Vision4Press platform.
Data correspond to usage on the plateform after 2015. The current usage metrics is available 48-96 hours after online publication and is updated daily on week days.
Initial download of the metrics may take a while.