Fig. 15.
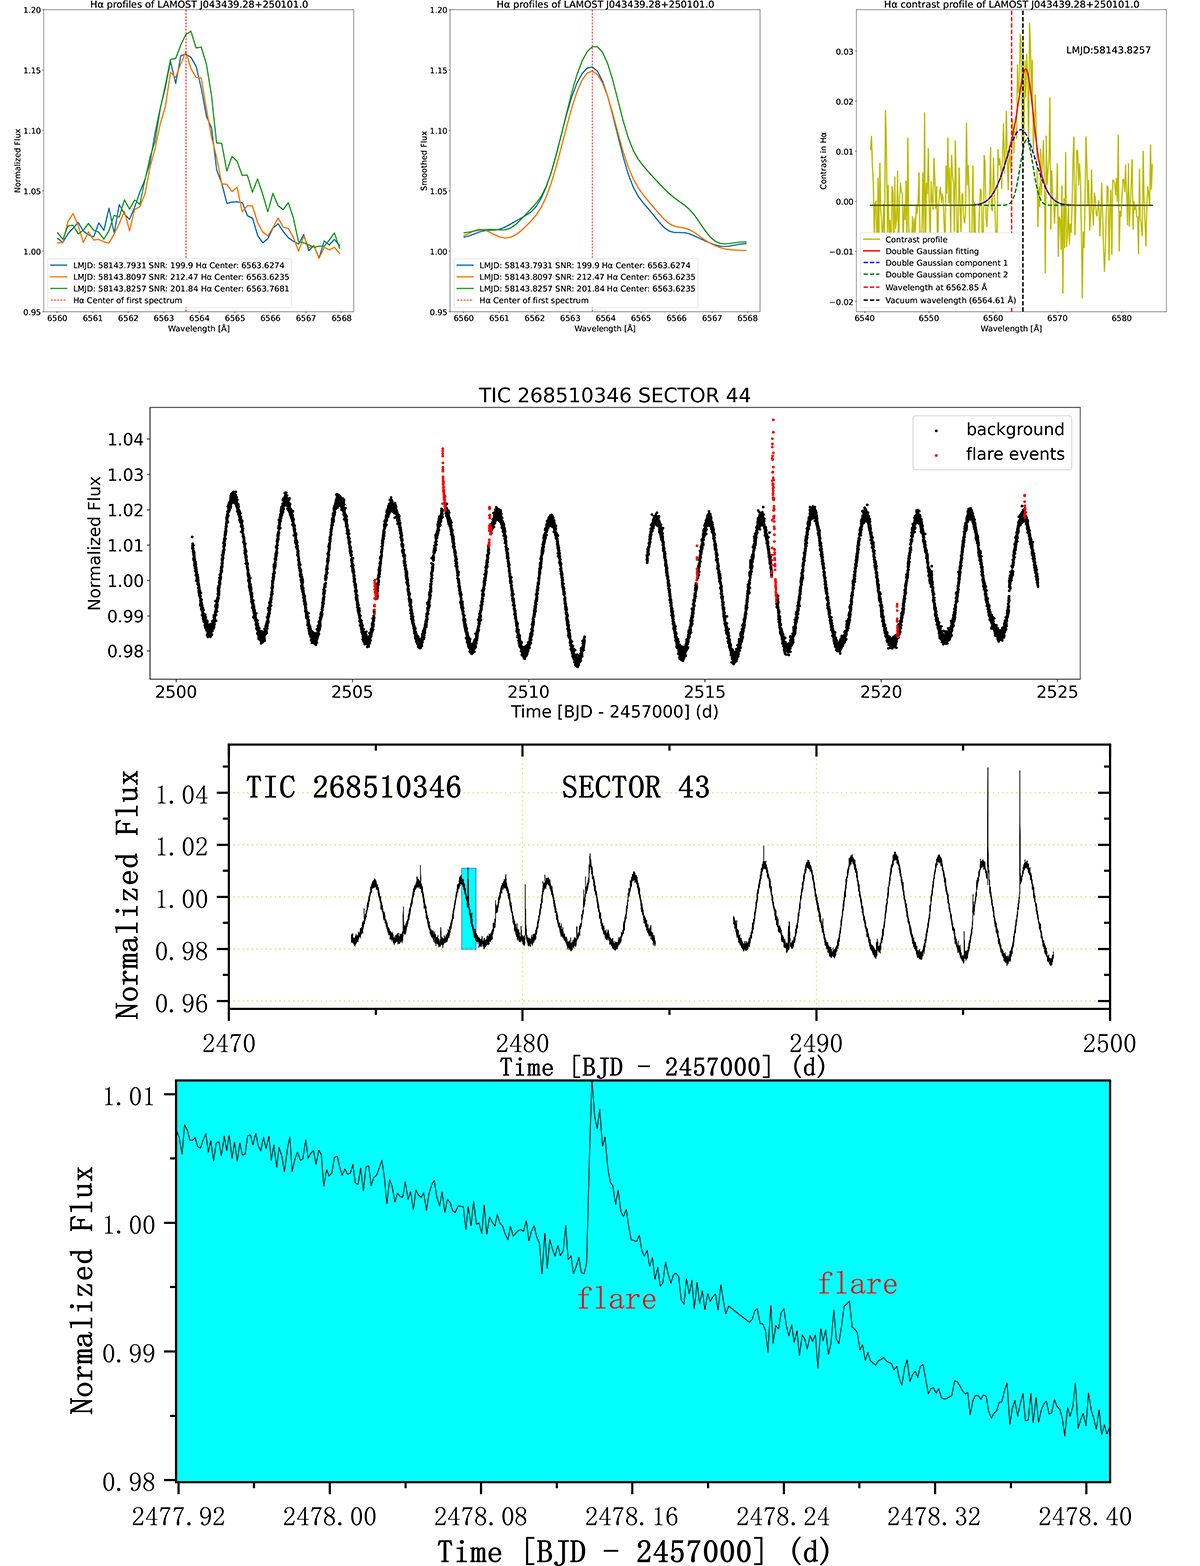
Download original image
Photometric and spectroscopic images for TIC 268510346. The top two (left and right) panels are normalized and smoothed Hα profiles, respectively. The red dashed line represents the peak position of the first spectrum. The LMJD, S/R, and Hα peak are shown in the legend. The top right panel is the double-Gaussian fitting result for the Hα contrast profile of the third active spectrum. The solid yellow line is the Hα contrast profile, and the solid red line is the double Gaussian fitting result. The dashed blue and green lines represent the two Gaussian components. The vertical dotted red and black lines indicate the wavelength of the Hα line at 6562.85 Å and the vacuum wavelength (6564.61 Å). The middle two panels show the TESS light curve of TIC 268510346 of SECTORs 44 and 43, and the bottom panel is the magnification of the blue area in SECTOR 43 light curve.
Current usage metrics show cumulative count of Article Views (full-text article views including HTML views, PDF and ePub downloads, according to the available data) and Abstracts Views on Vision4Press platform.
Data correspond to usage on the plateform after 2015. The current usage metrics is available 48-96 hours after online publication and is updated daily on week days.
Initial download of the metrics may take a while.