Fig. 14.
Download original image
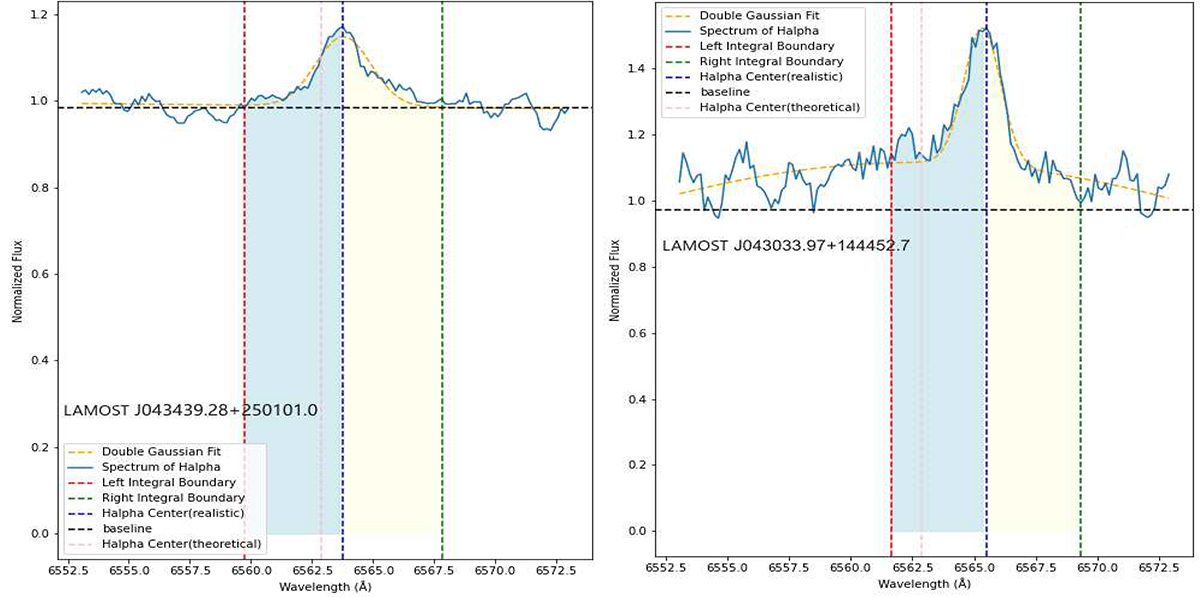
Two examples to show Hα profile asymmetries. The left panel corresponds to “LAMOST J043439.28+250101.0”, which has a LAMOST obsid = 634715116. The right panel corresponds to “LAMOST J043033.97+144452.7”, which has a LAMOST obsid = 763510066. The red and green dashed line represents the integration boundary, the pink and blue dashed lines represent the theoretical and actual peak positions of the Hα profile, respectively, and the bright blue and yellow line represents the integration area. The yellow dashed line is a double-Gaussian fitting result as a reference.
Current usage metrics show cumulative count of Article Views (full-text article views including HTML views, PDF and ePub downloads, according to the available data) and Abstracts Views on Vision4Press platform.
Data correspond to usage on the plateform after 2015. The current usage metrics is available 48-96 hours after online publication and is updated daily on week days.
Initial download of the metrics may take a while.