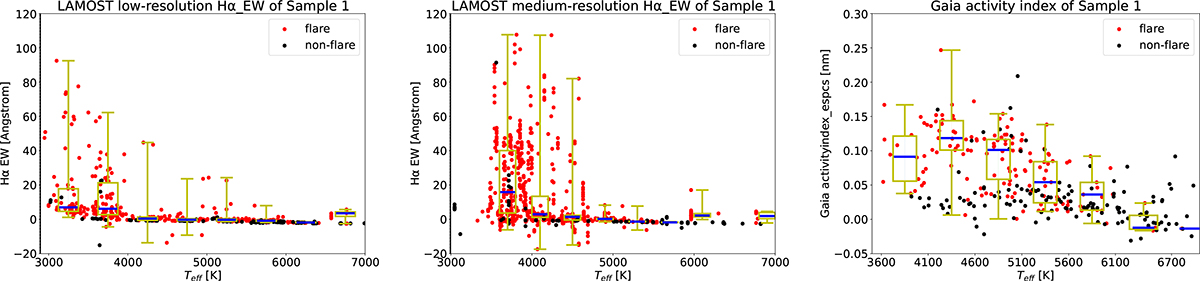
Fig. 13.
Download original image
Comparision of flare and non-flare stars in indicators of Hα EW and/or Gaia activity index. The left panel displays Hα EW from low-resolution spectra of LAMOST for both flare and nonflare radio stars. The middle panel is the same as the left but for medium-resolution spectra. The right panel displays the distribution of the Gaia DR3 activity index matched with Sample 1. The red dots represent flaring stars, while the black dots represent nonflaring stars. The Gaia Ca II IRT line activity indicator and the LAMOST Hα activity indicator of flaring stars are significantly larger than those of nonflaring stars.
Current usage metrics show cumulative count of Article Views (full-text article views including HTML views, PDF and ePub downloads, according to the available data) and Abstracts Views on Vision4Press platform.
Data correspond to usage on the plateform after 2015. The current usage metrics is available 48-96 hours after online publication and is updated daily on week days.
Initial download of the metrics may take a while.