Open Access
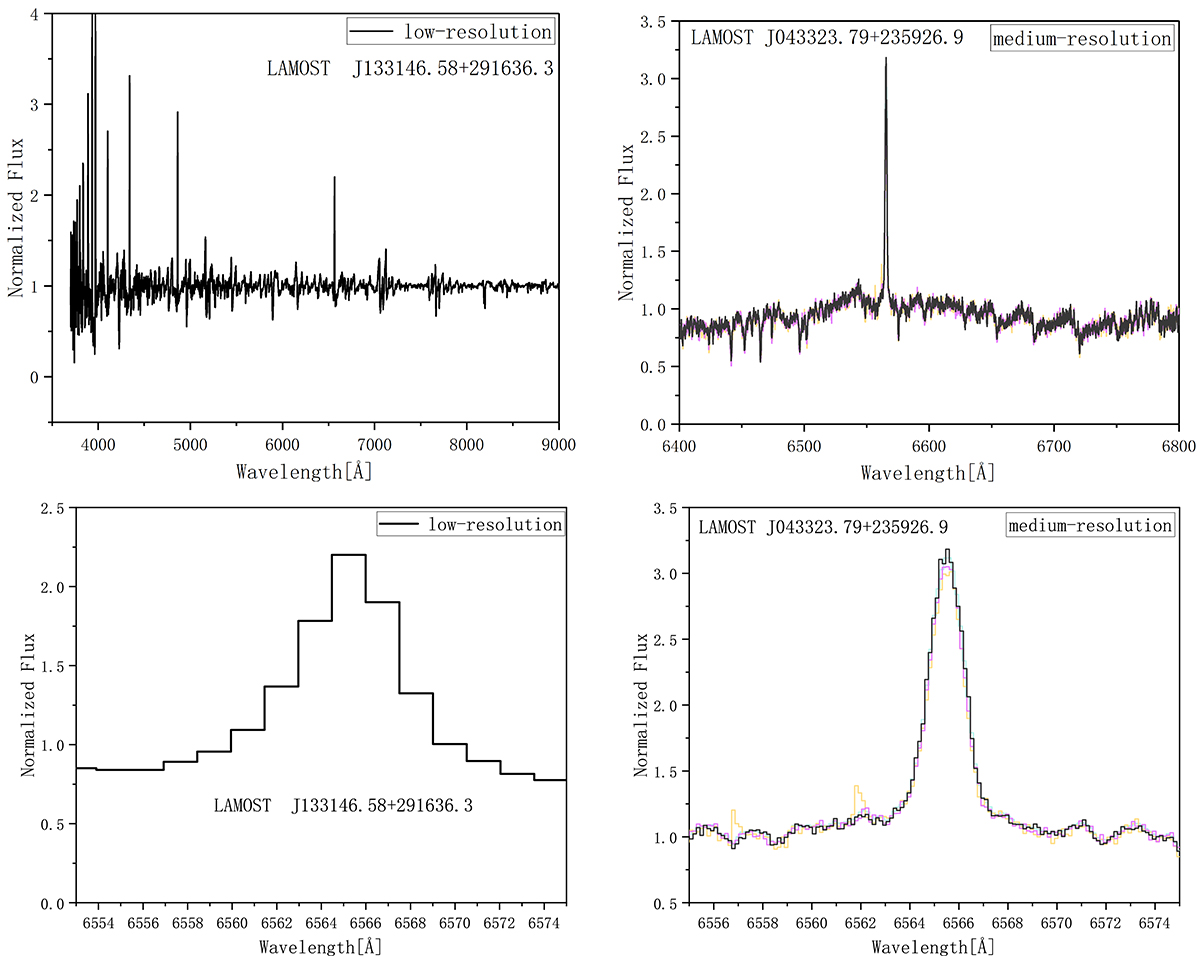
Fig. 12.
Download original image
Two examples of low-resolution and medium-resolution spectra from LAMOST. The top two panels present the whole spectrum and their Hα lines are given in the bottom two panels, respectively. Please note that only the red arm of the medium-resolution spectra is shown.
Current usage metrics show cumulative count of Article Views (full-text article views including HTML views, PDF and ePub downloads, according to the available data) and Abstracts Views on Vision4Press platform.
Data correspond to usage on the plateform after 2015. The current usage metrics is available 48-96 hours after online publication and is updated daily on week days.
Initial download of the metrics may take a while.