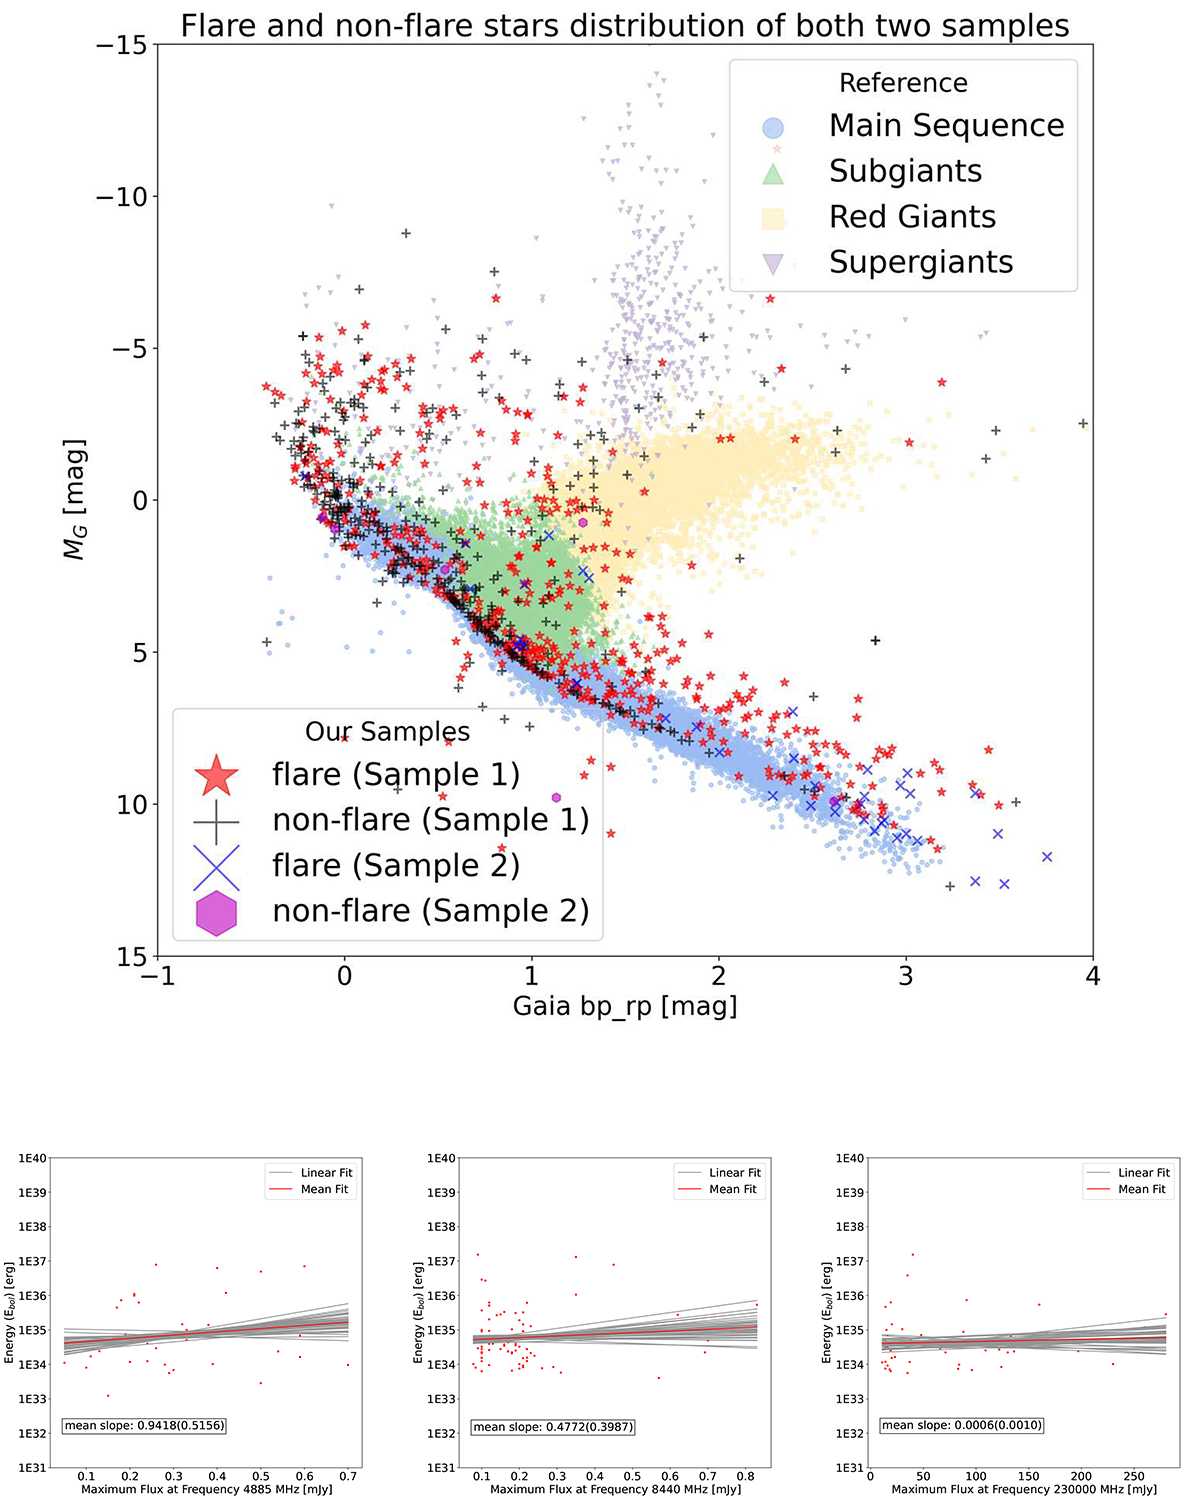
Fig. 11.
Download original image
Flare and non-flare stars distribution in Gaia bp_rp vs. absolute magnitude plot and the relationship between bolometric flare energy and maximum radio flux intensity. The top panel is the distribution comparison between flare and nonflaring stars in both samples, and the upper-right legend is similar to that in Fig. 1. In the bottom-left legend, we show the symbols representing flare and nonflaring stars in both samples. It can be observed that both flare and nonflaring stars are widely distributed across various evolutionary stages. For the bottom panels, we illustrate the distribution of flare energy and the corresponding maximum radio flux intensity for single stars of Sample 1 at different radio frequencies (4885, 8440, and 230 000 MHz). Here, the red lines are the average linear fit, and the slopes are marked in small boxes. There is no clear relationship observed.
Current usage metrics show cumulative count of Article Views (full-text article views including HTML views, PDF and ePub downloads, according to the available data) and Abstracts Views on Vision4Press platform.
Data correspond to usage on the plateform after 2015. The current usage metrics is available 48-96 hours after online publication and is updated daily on week days.
Initial download of the metrics may take a while.