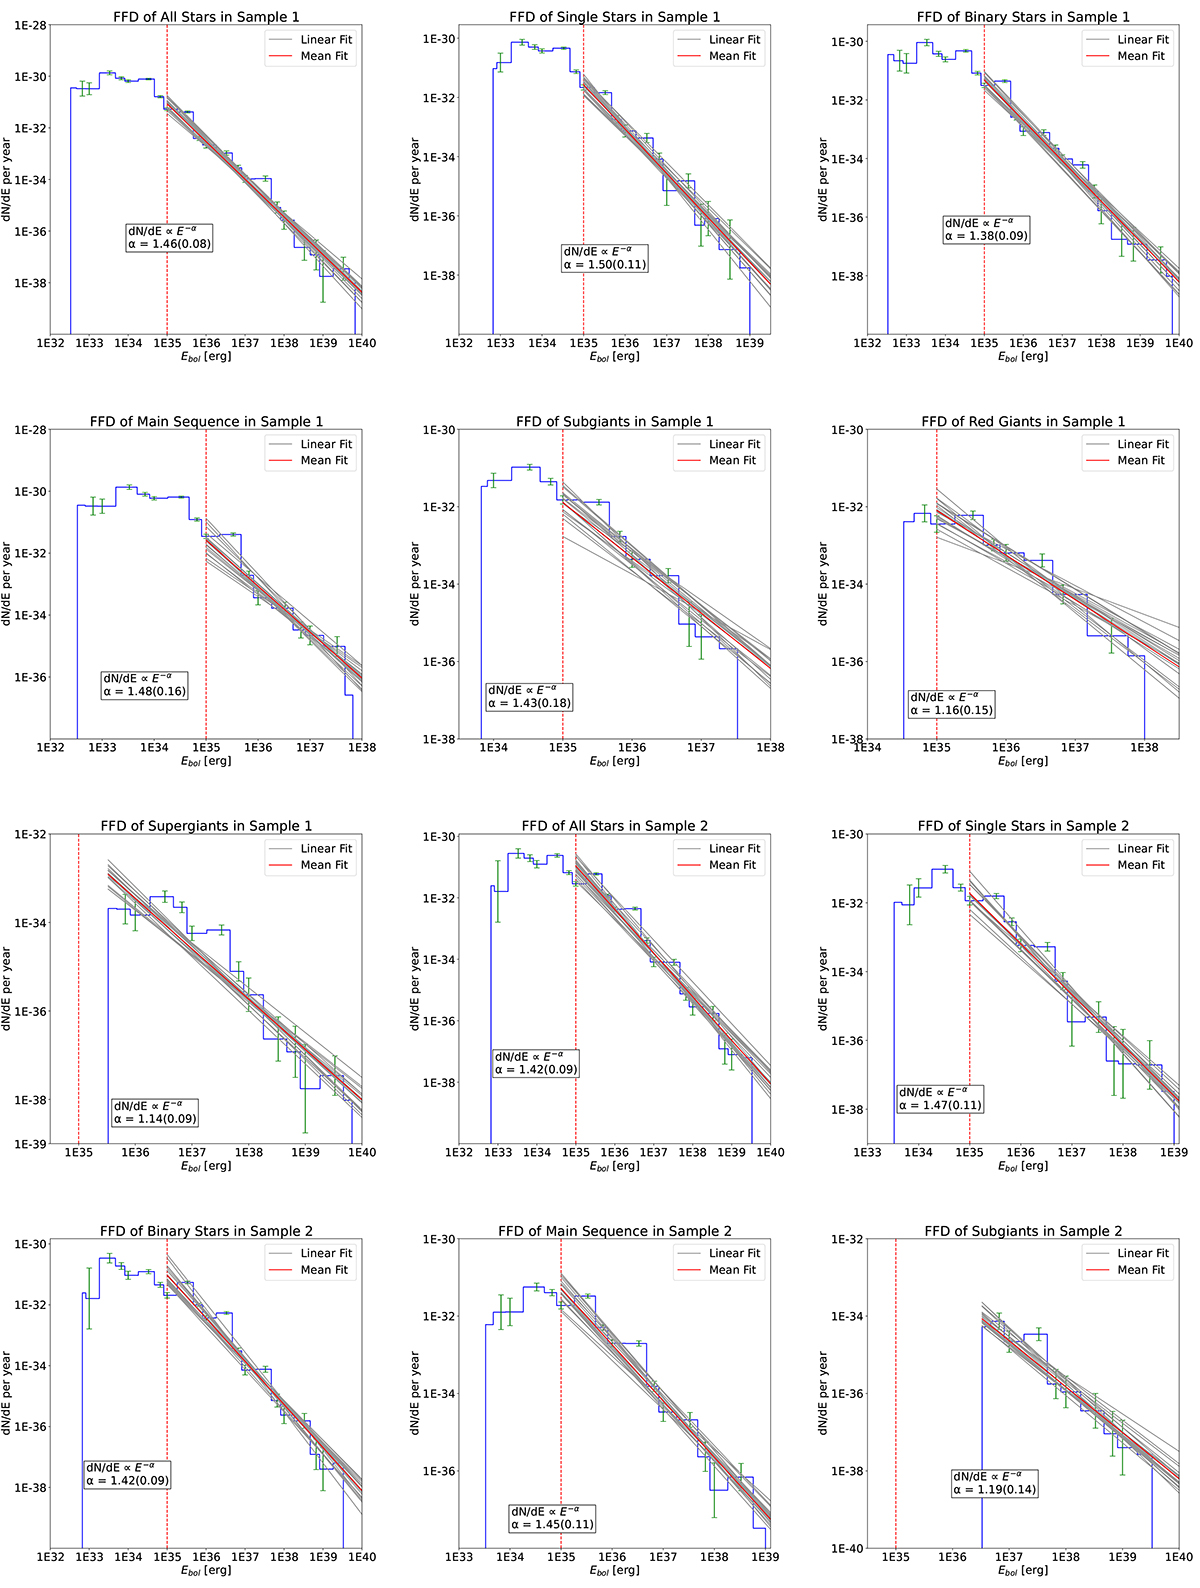
Fig. 10.
Download original image
Flare frequency distribution for all stars, single stars, binary stars, and stars in different evolutionary stages for both samples. Here, the power index value of alpha was obtained by fitting the energy greater than or equal to 1 × 1035 (represented by red vertical dashed lines) erg using the MCMC method and the green error bars represent the statistical error obtained by taking the square root of the total number of flares in the corresponding energy range.
Current usage metrics show cumulative count of Article Views (full-text article views including HTML views, PDF and ePub downloads, according to the available data) and Abstracts Views on Vision4Press platform.
Data correspond to usage on the plateform after 2015. The current usage metrics is available 48-96 hours after online publication and is updated daily on week days.
Initial download of the metrics may take a while.