Fig. 5.
Download original image
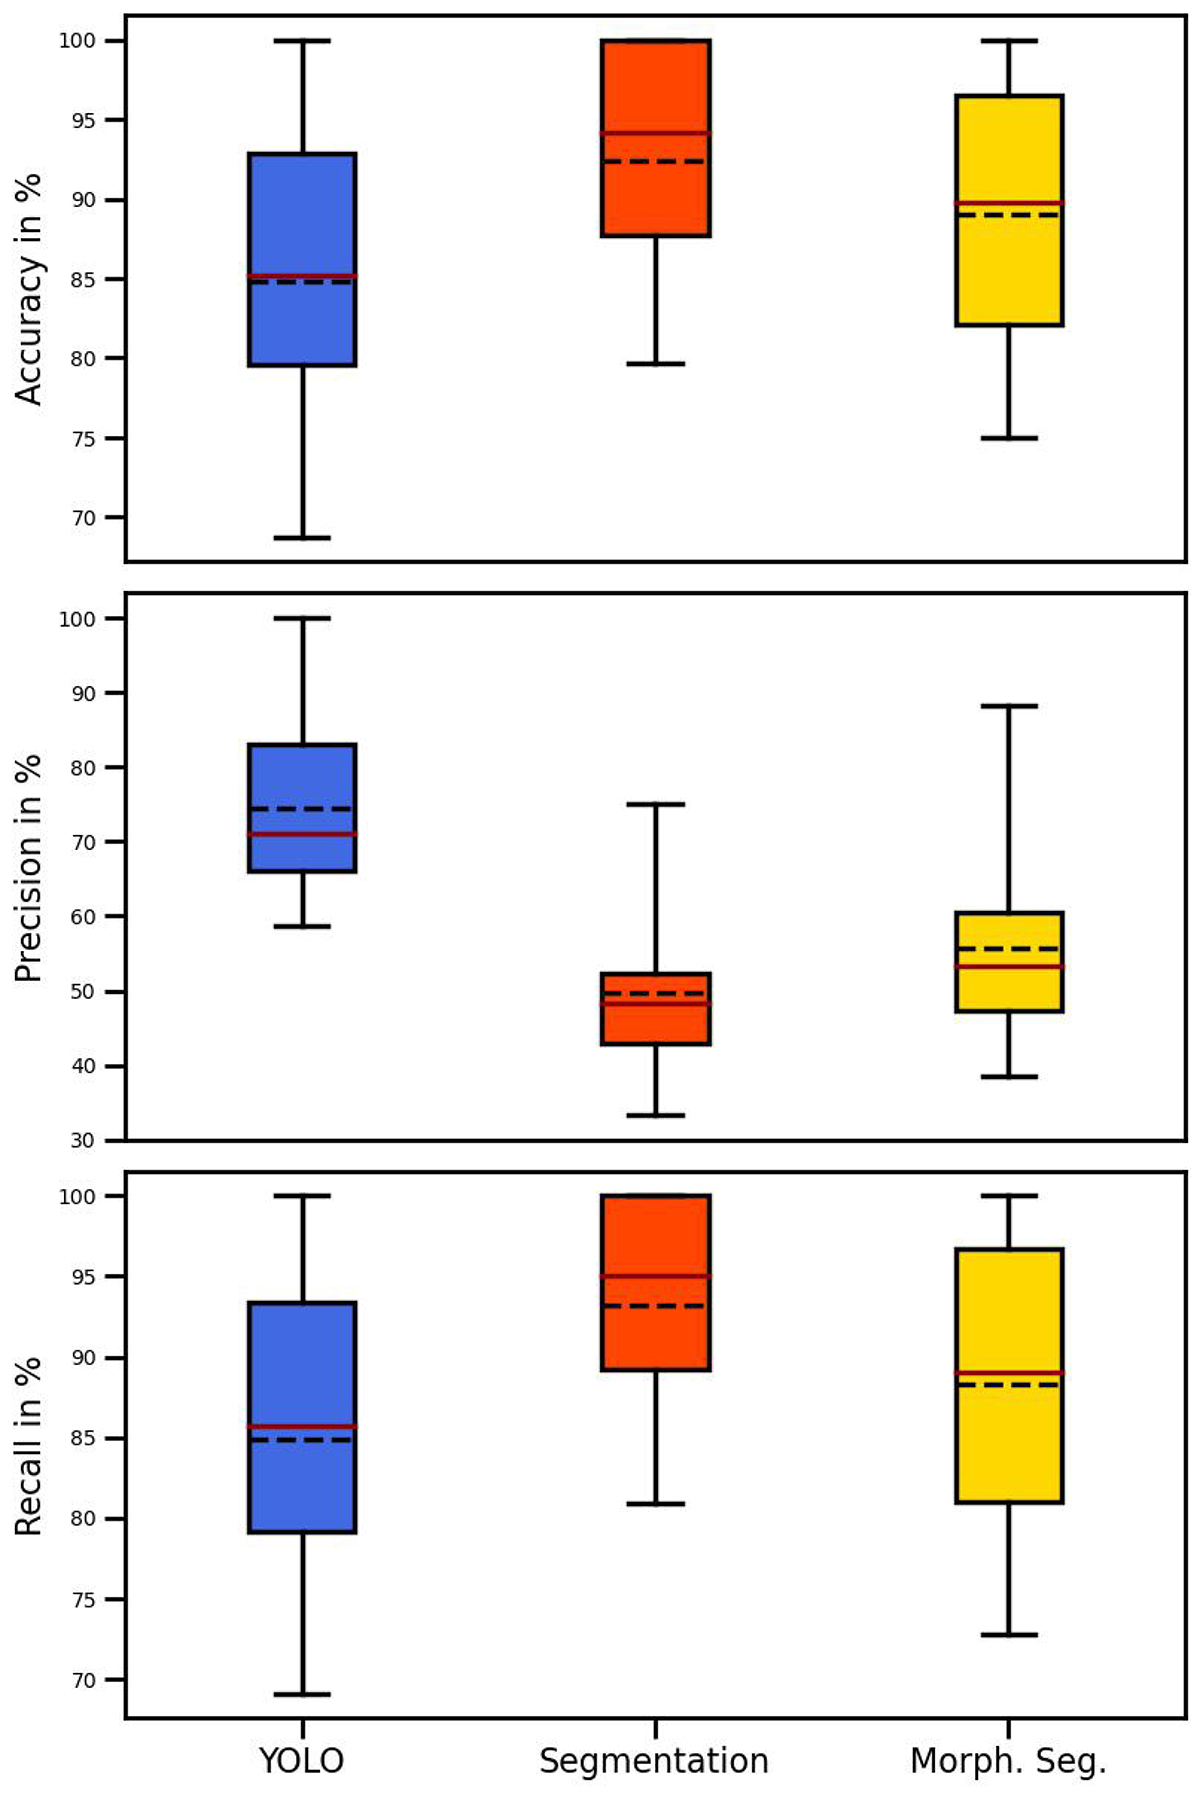
Box plots for the accuracy, precision, and recall in percent from YOLO object detection (left, blue box), the segmentation with u-net (middle, red box), and segmentation maps obtained from morphological image processing (right, yellow box). The box is displayed between the 25th and 75th percentiles, and whiskers between the 5th and 95th percentiles. The median is marked as a dark red line and the mean as a dashed black line.
Current usage metrics show cumulative count of Article Views (full-text article views including HTML views, PDF and ePub downloads, according to the available data) and Abstracts Views on Vision4Press platform.
Data correspond to usage on the plateform after 2015. The current usage metrics is available 48-96 hours after online publication and is updated daily on week days.
Initial download of the metrics may take a while.