Open Access
Fig. 14.
Download original image
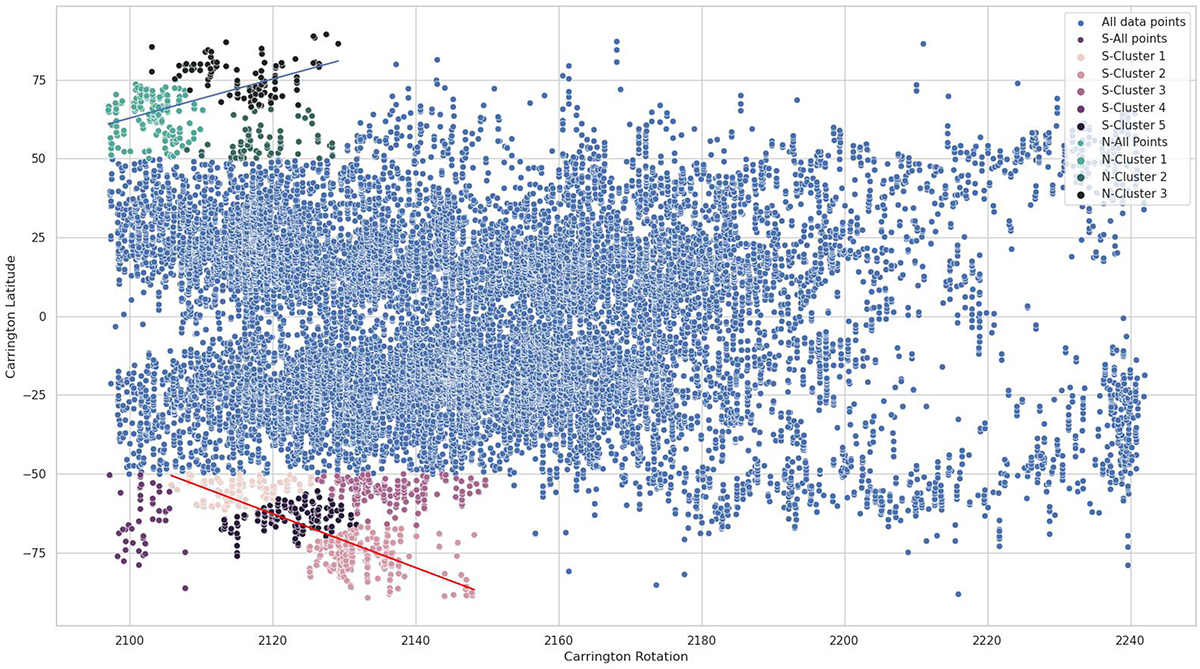
Scatter plot of detected filaments in the GONG data set (2010–2021) for Solar Cycle 24 (blue dots). We clustered the polar regions before the magnetic field reversal with k-Means and determined the rush-to-the-pole for the northern and southern hemispheres (blue and red line, respectively).
Current usage metrics show cumulative count of Article Views (full-text article views including HTML views, PDF and ePub downloads, according to the available data) and Abstracts Views on Vision4Press platform.
Data correspond to usage on the plateform after 2015. The current usage metrics is available 48-96 hours after online publication and is updated daily on week days.
Initial download of the metrics may take a while.