Fig. 5.
Download original image
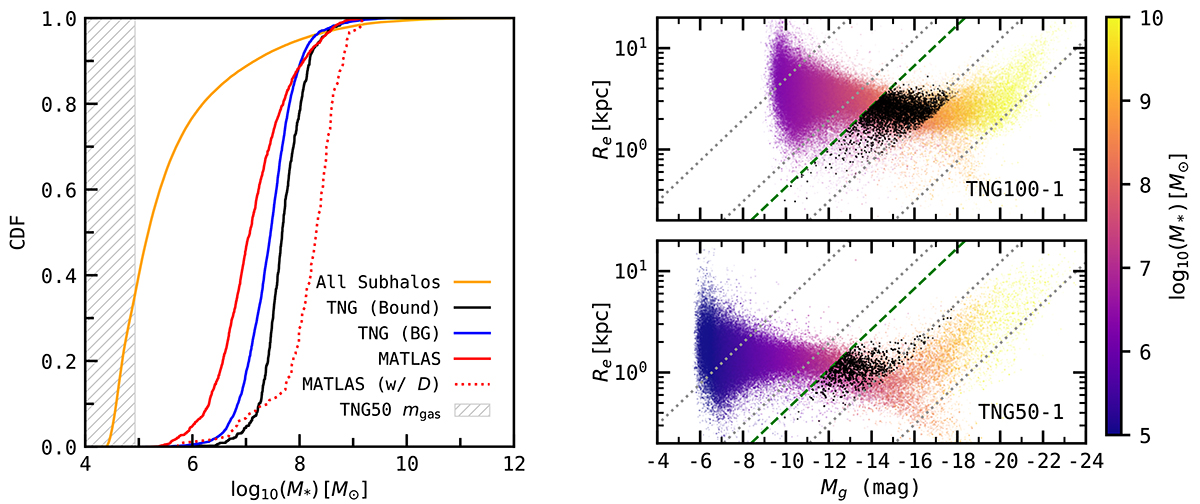
Left: stellar masses of TNG subhalos by their association to their supposed host galaxy (black and blue lines) and estimates for the MATLAS dwarfs from (red line; Habas et al. 2020). The latter estimates were made by assuming that the observed dwarfs lie at the same distance as their field’s target host galaxy. Stellar masses for the subset of MATLAS dwarfs for which independent distance estimates are available are plotted as a red dotted line. TNG50’s baryonic resolution mgas is indicated by the hatched region. 97% of MATLAS-like dwarfs in TNG50 are sufficiently resolved with at least 100 stellar particles. Right: impact of simulation resolution on dwarf populations. The lower panel is taken from Fig. 2 and shows the distribution of luminous subhalo properties in Re − Mg space in TNG50 (mgas = 8.5 × 10⁴ M⊙), while the upper panel instead displays results for the lower-resolution TNG100 run (mgas = 1.4 × 10⁶ M⊙). MATLAS-like dwarfs satisfying the selection criteria are plotted in black. The broadening in Re due to insufficient stellar particles occurs at around Mg > −12 in TNG100, but only affects Mg > −9 in TNG50 at a regime much fainter than the MATLAS-like dwarfs.
Current usage metrics show cumulative count of Article Views (full-text article views including HTML views, PDF and ePub downloads, according to the available data) and Abstracts Views on Vision4Press platform.
Data correspond to usage on the plateform after 2015. The current usage metrics is available 48-96 hours after online publication and is updated daily on week days.
Initial download of the metrics may take a while.