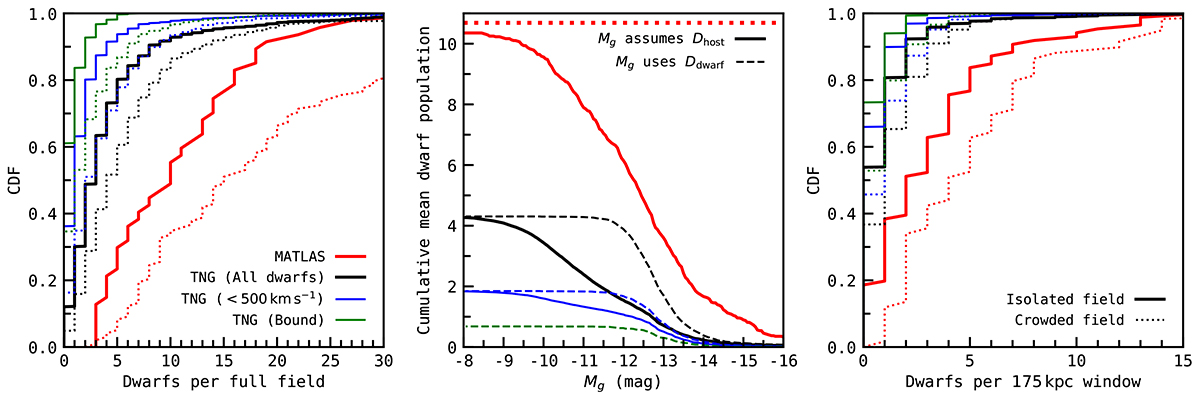
Fig. 3.
Download original image
Population of MATLAS-like dwarfs in TNG’s mock-observed fields is significantly lower than observed in the MATLAS low density fields. Left: dwarf counts in the 63′ by 69′ MATLAS fields (red) and MATLAS-like fields mock-observed in TNG50 (black). Dwarf galaxies that appear to be physically associated with the targeted hosts (by a radial velocity difference of < 500 km s−1) are also shown in blue, while dwarfs bound to their host galaxy’s halo are drawn in green. Solid lines indicate fields around isolated MATLAS and MATLAS-like host galaxies that lack a companion with a magnitude of < MK + 1 within 1 Mpc, while dotted lines represent the remaining fields. Dwarf populations of isolated TNG fields are inconsistent with these isolated MATLAS fields – even when including unassociated interlopers in the former – at a 7σ confidence level. Centre: cumulative luminosity functions for MATLAS and TNG dwarfs in isolated fields. The solid line represents dwarf absolute magnitudes derived by assuming they lie at their supposed host galaxy’s distance (like the MATLAS dwarfs), while the dashed line adopts their true distances instead. Since around 3% of the MATLAS dwarfs lack mg estimates, the red dotted line indicates the true mean population of MATLAS dwarfs per field. Right: same as the left panel, but only counting dwarfs that lie within a square field with physical dimensions of 175 kpc centred upon each targeted host galaxy corresponding to the MATLAS field size at the near bound of 10 Mpc.
Current usage metrics show cumulative count of Article Views (full-text article views including HTML views, PDF and ePub downloads, according to the available data) and Abstracts Views on Vision4Press platform.
Data correspond to usage on the plateform after 2015. The current usage metrics is available 48-96 hours after online publication and is updated daily on week days.
Initial download of the metrics may take a while.